Learn & Explore
Pricing details, the technical story behind this site, and practical advice for growing your business online.
Pricing & Services
Every project is unique, but here are ballpark ranges:
**Simple Landing Page:** $1,500 - $3,500
- Single page with sections
- Contact form
- Mobile responsive
- Basic SEO setup
**Business Website:** $4,000 - $12,000
- 5-10 custom pages
- CMS integration (optional)
- Advanced animations
- SEO optimization
- Analytics setup
**Custom Web Application:** $15,000+
- User authentication
- Database integration
- Custom features
- Admin dashboard
- Ongoing maintenance
What's included:
- Design & development
- Mobile responsiveness
- Basic SEO setup
- 30-day post-launch support
Not included (but available):
- Ongoing maintenance plans
- Content writing
- Photography/videography
- Paid advertising management
Contact us for a free quote tailored to your specific needs!
Absolutely. You don't need a new website to work with us. If you already have a site and want to grow your traffic, reach more customers, or understand your audience better, we offer standalone digital marketing services.
What we offer:
SEO & GEO (Generative Engine Optimization):
Traditional search optimization plus optimization for AI-powered search results. We help your business's visibility whether someone is searching on Google, Bing, or asking ChatGPT.
Google Ads & PPC Management:
Campaign setup, keyword research, ad copywriting, bid optimization, and ongoing performance tracking. We're Google-certified and work directly in the tools your campaigns depend on.
Email Marketing:
Campaign strategy, template design, list segmentation, automation flows, and performance analytics. We work with platforms like Mailchimp, Constant Contact, or whichever tool fits your business.
Social Media Marketing:
Content strategy, scheduling, audience targeting, and paid social campaigns across the platforms where your customers spend time.
Analytics & User Behavior:
We set up Google Analytics, Google Search Console, and Microsoft Clarity to collect meaningful data about your visitors. Then we analyze heatmaps, session recordings, and conversion funnels to find exactly where users drop off and how to fix it.
Tools we specialize in:
Google Analytics, Google Ads, Google Search Console, Microsoft Clarity, Mailchimp, HubSpot, Hootsuite, and more. If you have a preferred tool, we can work with it.
Pricing:
**One-Time Setup & Audit:** $300 - $1,000
- SEO/technical audit of your existing site
- Analytics and tracking setup (GA4, Search Console, Clarity)
- Competitor analysis and keyword research
- Actionable recommendations report
**Monthly SEO & GEO:** $250 - $700/month
- On-page and technical SEO improvements
- Content optimization for search and AI engines
- Monthly ranking and traffic reports
- Ongoing keyword and competitor monitoring
**Google Ads Management:** $200 - $600/month + ad spend
- Campaign setup and keyword strategy
- Ad copy and landing page recommendations
- Bid optimization and A/B testing
- Monthly performance reporting
**Email Marketing:** $150 - $500/month
- Campaign strategy and template design
- List segmentation and automation setup
- Performance tracking and optimization
**Social Media Management:** $300 - $900/month
- Content calendar and scheduling
- Platform-specific strategy
- Paid social campaign management
- Monthly engagement and growth reports
**Full-Service Bundle:** Custom pricing
- Combine any of the above at a discounted rate
- Single point of contact for all your marketing
- Unified reporting across all channels
We keep our rates competitive because we believe good marketing shouldn't be gatekept behind agency-level budgets. Contact us for a free consultation and we'll build a plan around your goals.
Project timelines vary based on complexity, but here are general estimates:
Landing Page / Portfolio Site:
2-4 weeks
- Design mockups: 3-5 days
- Development: 1-2 weeks
- Testing & revisions: 3-5 days
Business Website (5-10 pages):
4-8 weeks
- Discovery & planning: 1 week
- Design: 1-2 weeks
- Development: 2-4 weeks
- Content & testing: 1 week
Web Application:
8-16+ weeks
- Requirements & architecture: 2-3 weeks
- UI/UX design: 2-3 weeks
- Development: 4-8+ weeks
- Testing & deployment: 1-2 weeks
Factors that affect timeline:
- Content readiness (copy, images, branding)
- Number of revision rounds
- Third-party integrations
- Custom features and animations
How We Built This Site
This site uses a single-page application (SPA) approach built with Next.js. Instead of traditional page navigation where the browser loads entirely new HTML documents, we keep a persistent 3D cube scene and swap out the content based on which "page" you select.
The navigation flow:
When you click a nav item or spin the cube, the site doesn't do a full page reload. Instead, it:
1. Updates a React state variable (currentPage)
2. Uses window.history.pushState() to change the URL without reloading
3. Conditionally renders the appropriate section component (About, Services, FAQ, etc.)
The visual experience:
On first load, a loading screen plays while assets initialize. Once ready, you see the 3D cube with a title and scroll indicators. Scrolling down triggers a GSAP ScrollTrigger animation that fades out the cube and fades in the page content. This creates a layered experience where the cube acts as a landing area and the content lives below it.
The page structure:
Each route (/about, /services, /faq, etc.) has its own page.tsx file with unique metadata (title, description, Open Graph tags). These files import and render the main HomePage component, which reads the current URL path to determine which section to display. This gives us the best of both worlds: proper server-rendered HTML at each URL for search engines, and smooth client-side transitions for users.
This architecture raises an important question: how do you keep animated, JS-heavy sites visible to Google's crawlers? The next two questions cover that.
// From page.tsx - The core navigation logic

const renderPageContent = () => {
  switch (currentPage) {
    case 'Home':
      return <LandingPage />;
    case 'About':
      return <AboutSection />;
    case 'Our Work':
      return <OurWorkSection />;
    case 'Services':
      return <ServiceConstellation />;
    case 'Contact':
      return <ContactSection />;
    case 'FAQ':
      return <FAQSection />;
    default:
      return <LandingPage />;
  }
};

// URL changes without page reload
const handlePageSelect = (page: string) => {
  setCurrentPage(page);
  window.history.pushState({}, '', newRoute);
};It can be, but only if you handle it carefully. The default SPA pattern has a real problem with Google's crawlers that most developers overlook.
The hidden content problem:
As described above, this site uses a loading screen and scroll-triggered animations. The naive implementation would use inline styles like style={{ visibility: 'hidden' }} and style={{ opacity: 0 }} directly in the JSX to keep content hidden until JavaScript reveals it. The issue is that inline styles are baked into the server-rendered HTML. When Googlebot reads that HTML, it sees content marked as invisible and may ignore or devalue it entirely.
Our hybrid architecture:
- Each route (/about, /services, /faq) has its own page.tsx with unique metadata
- Direct URL access serves proper server-rendered HTML with real content
- Client-side navigation uses conditional rendering for smooth 3D transitions
- URLs update via pushState() so bookmarks and browser history work normally
What makes it SEO-safe:
The key is progressive enhancement. The server-rendered HTML at every URL contains fully visible, crawlable content with no inline hidden styles. All visual transitions (the loading screen, scroll-triggered fade-ins, and animations) are handled entirely by client-side JavaScript and GSAP's ScrollTrigger, which only initializes after loading completes. This means Google's crawler sees clean, readable HTML, while users get the full animated experience. The next question explains exactly how this works with code.
For client projects, we recommend:
- Using Next.js App Router with proper page files
- Server-side rendering for content-heavy pages
- Static generation for marketing pages
- Progressive enhancement to keep animated sites crawlable
- Reserving SPA patterns for dashboards and apps where SEO isn't critical
Sites with loading screens, 3D scenes, and scroll-triggered animations often have a critical SEO problem: the content is hidden behind CSS properties like visibility: hidden and opacity: 0 on initial render. Google's crawler renders pages with JavaScript, and if your content is invisible in the rendered output, it may be ignored or devalued during indexing.
The problem:
When a site uses a loading screen pattern, the typical approach is to render the layout with visibility: hidden and content with opacity: 0 as inline styles, then use JavaScript to reveal them after loading completes. Even if you use useLayoutEffect to set these styles (which doesn't run during SSR), Google's renderer executes JavaScript and will see those hidden styles in the rendered DOM.
The solution - Progressive Enhancement:
Instead of shipping hidden content in the HTML, you flip the default: ship visible content and let your animation library handle visibility transitions. The key principles:
1. Never set opacity: 0 or visibility: hidden as inline styles in your JSX
2. Use React's useLayoutEffect only for layout visibility during loading (it doesn't run during SSR)
3. Let GSAP's ScrollTrigger control content opacity through fromTo() animations that only initialize after loading completes
4. The SSR HTML stays completely clean with no hidden styles
How it works in practice:
- The layout wrapper uses useLayoutEffect for visibility: hidden during loading, then visible after
- Content opacity is controlled entirely by GSAP's scroll timeline using fromTo({ opacity: 0 }, { opacity: 1 })
- The GSAP timeline only initializes after the loading screen completes, keeping the SSR HTML clean
- For entrance animations (fade-in, slide-in), use immediateRender: false so GSAP only applies initial hidden states when the ScrollTrigger fires, not on creation
Why this works:
- Server-side render: No JavaScript runs, content is fully visible at default opacity
- Client hydration: useLayoutEffect hides layout during loading (loading screen covers everything)
- After loading: GSAP ScrollTrigger creates the scroll animation timeline with fromTo()
- Users scroll to reveal content through the animated transition
- Zero visual difference for users, fully crawlable HTML for Google
This matters because:
Google explicitly states that content hidden via visibility: hidden or opacity: 0 may not be indexed. By keeping your SSR output clean and deferring all opacity changes to animation libraries that only run client-side after loading, you get the best of both worlds: rich interactive experiences for users AND clean, visible HTML for search engines.
// PageLayout.tsx - Progressive Enhancement for SEO
// SSR output has NO inline hidden styles - content is visible to crawlers

// 1. useLayoutEffect handles layout visibility only
useLayoutEffect(() => {
  if (layoutRef.current) {
    layoutRef.current.style.visibility = isLoading ? 'hidden' : 'visible';
  }
}, [isLoading]);

// 2. GSAP handles content opacity via scroll animation
// Only initializes after loading completes
useLayoutEffect(() => {
  if (isLoading) return;
  const ctx = gsap.context(() => {
    const tl = gsap.timeline({
      scrollTrigger: {
        trigger: layoutRef.current,
        start: 'top top',
        end: '100vh top',
        scrub: 0.5,
      },
    });
    // fromTo() sets opacity:0 only when timeline is created (client-side)
    // SSR HTML has no opacity:0 - fully visible for crawlers
    tl.fromTo(contentRef.current,
      { opacity: 0 },
      { opacity: 1, duration: 1, ease: 'none' },
    0);
  }, layoutRef);
  return () => ctx.revert();
}, [isLoading]);

// In JSX - no inline styles that would hide content:
<div ref={layoutRef} className={styles.layout}>
  {/* ... cube, nav, animations ... */}
  <div ref={contentRef} className={styles.pageContent}>
    {children}  {/* Visible in SSR HTML for crawlers */}
  </div>
</div>Because Next.js provides the server-side rendering (SSR) that makes everything described above actually work.
SSR is the foundation:
The progressive enhancement technique from the previous question only works because Next.js renders your React components to HTML on the server before sending them to the browser. Without SSR, there would be no visible HTML for Google to crawl. A plain React SPA (like Create React App) sends an empty HTML shell and builds everything in the browser, which means crawlers see nothing. Next.js gives us real HTML with real content at every URL.
What else we use from Next.js:
- **Server-Side Rendering**: The foundation for crawlable content and progressive enhancement
- **Metadata API**: Each route exports its own title, description, and Open Graph tags
- **Image Optimization**: Next/Image automatically optimizes and lazy-loads images
- **Font Optimization**: Automatic font loading with zero layout shift
- **API Routes**: Our contact form uses Next.js API routes (/api/contact)
- **Build Optimization**: Automatic code splitting and bundling
- **TypeScript Support**: First-class TypeScript integration
The takeaway:
Even if you're building a creative, animation-heavy SPA, a framework with SSR is essential for SEO. Next.js handles the server rendering, metadata, and build optimization so you can focus on the experience. The SPA navigation, 3D cube, and scroll animations are layered on top of that SSR foundation.
Once your content is visible to crawlers (via progressive enhancement) and your pages have proper metadata (via Next.js SSR), you still need to tell search engines where to find everything. That's where sitemaps and robots.txt come in.
Sitemaps:
A sitemap is a roadmap for search engines. It lists every page on your site, how often each one changes, and which pages are most important. Google and Bing use this to discover and prioritize your content. Next.js makes generating one simple with the built-in sitemap() function.
robots.txt:
This file tells crawlers what they're allowed to access. You can block specific paths (like /api/ or internal test pages) while keeping everything else open. It's also where you reference your sitemap URL so crawlers find it automatically.
The full SEO picture for this site:
1. Next.js SSR generates real HTML with visible content at each URL
2. Progressive enhancement keeps that content visible to crawlers while layering animations on top for users
3. Each route has its own metadata (title, description, Open Graph tags)
4. The sitemap lists all public pages with priority and change frequency
5. robots.txt points crawlers to the sitemap and blocks private routes
6. Schema.org structured data (JSON-LD) provides rich context for search results
For larger sites (100+ pages):
- Use dynamic sitemap generation from your CMS or database
- Split into multiple sitemaps (sitemap index)
- Automate lastModified dates from actual content updates
- Submit sitemaps directly in Google Search Console and Bing Webmaster Tools
**Pro tip:** After launching, submit your sitemap in Google Search Console and use the URL Inspection tool to verify Google can see your content. This confirms your progressive enhancement is working and speeds up initial indexing.
// src/app/sitemap.ts - Sitemap generation

import { MetadataRoute } from 'next'

export default function sitemap(): MetadataRoute.Sitemap {
  const baseUrl = 'https://www.star-ascension.com'
  const currentDate = new Date()

  return [
    {
      url: baseUrl,
      lastModified: currentDate,
      changeFrequency: 'monthly',
      priority: 1.0,
    },
    {
      url: `${baseUrl}/about`,
      lastModified: currentDate,
      changeFrequency: 'monthly',
      priority: 0.8,
    },
    // ... additional routes
  ]
}

// src/app/robots.ts - Crawler access rules

import { MetadataRoute } from 'next'

export default function robots(): MetadataRoute.Robots {
  return {
    rules: [
      {
        userAgent: '*',
        allow: '/',
        disallow: ['/api/', '/cube-test/'],
      },
    ],
    sitemap: 'https://www.star-ascension.com/sitemap.xml',
  }
}This site is built with a modern React stack:
Frontend:
- **Next.js 14+** - React framework with App Router
- **React 18** - UI library with hooks
- **TypeScript** - Type-safe JavaScript
- **CSS Modules** - Scoped styling
3D & Animation:
- **Three.js** - 3D graphics library
- **React Three Fiber** - React renderer for Three.js
- **@react-three/drei** - Useful Three.js helpers
- **GSAP** - Professional animation library
- **ScrollTrigger** - Scroll-based animations
Backend:
- **Next.js API Routes** - Serverless functions
- **Nodemailer** - Email sending for contact form
Hosting:
- Optimized for Vercel deployment
The navigation bar on this site can be dragged around the screen and repositioned anywhere you like! This is a custom implementation using React state management and GSAP animations. Here's how it works:
Core Concept:
The nav bar tracks its position using a "drag state" ref that stores:
- Whether dragging is active
- The starting mouse/touch position
- The current offset from the original position
How the drag works:
1. When you mousedown/touchstart, we record the starting position
2. As you move, we calculate the new offset from the start point
3. GSAP smoothly animates the element to follow your cursor
4. Bounds checking keeps it within the viewport
5. On release, the position is saved so the next drag continues from there
Special behaviors:
- Clicking navigation buttons doesn't trigger dragging
- When you navigate to a new page, the nav snaps back to its default position with a satisfying elastic animation
- The "drag me" hint appears for 5 seconds on first load, then fades away
- Mobile hamburger menu can also be dragged around the screen!
Why we built this:
We wanted to demonstrate that UI elements don't have to be static. It's a small touch that makes the site feel more interactive and playful, while also being genuinely useful if the nav is blocking content you want to see.
// NavigationBar.tsx - Draggable nav implementation

interface DragState {
  isDragging: boolean;
  startX: number;
  startY: number;
  offsetX: number;
  offsetY: number;
}

// Store drag state in a ref (doesn't trigger re-renders)
const dragState = useRef<DragState>({
  isDragging: false,
  startX: 0,
  startY: 0,
  offsetX: 0,
  offsetY: 0,
});

// On drag start, record where we began
const handleDragStart = (clientX: number, clientY: number) => {
  setShowDragHint(false);
  dragState.current = {
    isDragging: true,
    startX: clientX - dragState.current.offsetX,
    startY: clientY - dragState.current.offsetY,
    offsetX: dragState.current.offsetX,
    offsetY: dragState.current.offsetY,
  };
};

// On move, calculate new position with bounds checking
const handleDragMove = (clientX: number, clientY: number, target: HTMLElement) => {
  if (!dragState.current.isDragging || !target) return;

  const newX = clientX - dragState.current.startX;
  const newY = clientY - dragState.current.startY;

  // Keep within viewport bounds (with padding)
  const rect = target.getBoundingClientRect();
  const originalX = rect.left - dragState.current.offsetX;
  const originalY = rect.top - dragState.current.offsetY;

  const padding = 10;
  const minX = -originalX + padding;
  const maxX = window.innerWidth - originalX - rect.width - padding;
  const minY = -originalY + padding;
  const maxY = window.innerHeight - originalY - rect.height - padding;

  const constrainedX = Math.max(minX, Math.min(newX, maxX));
  const constrainedY = Math.max(minY, Math.min(newY, maxY));

  // GSAP smoothly animates to new position
  gsap.to(target, {
    x: constrainedX,
    y: constrainedY,
    duration: 0.1,
    ease: 'power2.out',
  });

  // Save position for next drag
  dragState.current.offsetX = constrainedX;
  dragState.current.offsetY = constrainedY;
};

// Snap back to default on page change
useEffect(() => {
  if (navContainerRef.current) {
    gsap.to(navContainerRef.current, {
      x: 0,
      y: 0,
      duration: 0.6,
      ease: 'elastic.out(1, 0.5)', // Bouncy snap-back!
    });
    dragState.current.offsetX = 0;
    dragState.current.offsetY = 0;
  }
}, [currentPage]);
Digital Growth Playbook
Recently I was deep in the weeds optimizing this site when I noticed something frustrating. The SEO score was stuck at 92, and I couldn't figure out why. The content was good. The meta tags were right. Everything looked fine.
Enter Google Lighthouse.
If you haven't met Lighthouse yet, it's a free tool that lives inside Google Chrome. Think of it like a health checkup for your website. You push a button, it runs some tests, and it tells you what's broken, what's slow, and what search engines might hate about your site. It scores you on Performance, Accessibility, Best Practices, and SEO.
Here's a step-by-step that walks you through running your own audit, and the solution to this annoying little bug.
1. Open Your Site and Inspect It
Go to your website in Google Chrome. Any page works, but start with your homepage if you're new to this. Right-click anywhere on the page and select "Inspect" from the menu. If you're a keyboard person, press F12. A big panel will open up on the side or bottom of your browser. That's DevTools. It looks intimidating, but we're only using one tab.
2. Find the Lighthouse Tab
Look across the top of that new panel. You'll see tabs like Elements, Console, Sources, Network. Click the one that says "Lighthouse." If you don't see it, click the double arrow to find it hiding in the overflow menu.
3. Choose Your Settings
Lighthouse will ask you what to check:
- Performance (how fast your page loads)
- Accessibility (can people with disabilities use it?)
- Best Practices (are you following modern coding standards?)
- SEO (can search engines understand it?)
Check all of them. Why not? You're here. Then choose "Mobile" or "Desktop." Mobile is usually more important because Google primarily uses the mobile version of your site for ranking. But running both is a good habit.
4. Run the Audit
Click the big "Analyze page load" button. Lighthouse will reload your page and spend about 30 to 60 seconds running tests. Go grab coffee. Or just stare at the screen and watch the progress bar. I do both.
When it's done, you'll see a report with scores from 0 to 100 for each category, plus a list of specific things to fix.
5. Understand What the SEO Audit Actually Checks
This part tripped me up at first. The SEO section isn't guessing. It's checking very specific technical boxes:
- Do you have a title tag and a meta description?
- Is your robots.txt file valid and not blocking search engines?
- Is your page indexable? (No "noindex" tags hiding in the code?)
- Do your images have alt text for accessibility and SEO?
- Do your links have descriptive text instead of just "click here"?
- Do you have a canonical URL telling search engines which version of the page is the original?
- Do you have structured data? That's the Schema.org markup that helps Google show rich results.
- Is your page mobile-friendly?
If any of these are missing or broken, Lighthouse will flag them.
6. The Robots.txt Mystery (A Real Debugging Story)
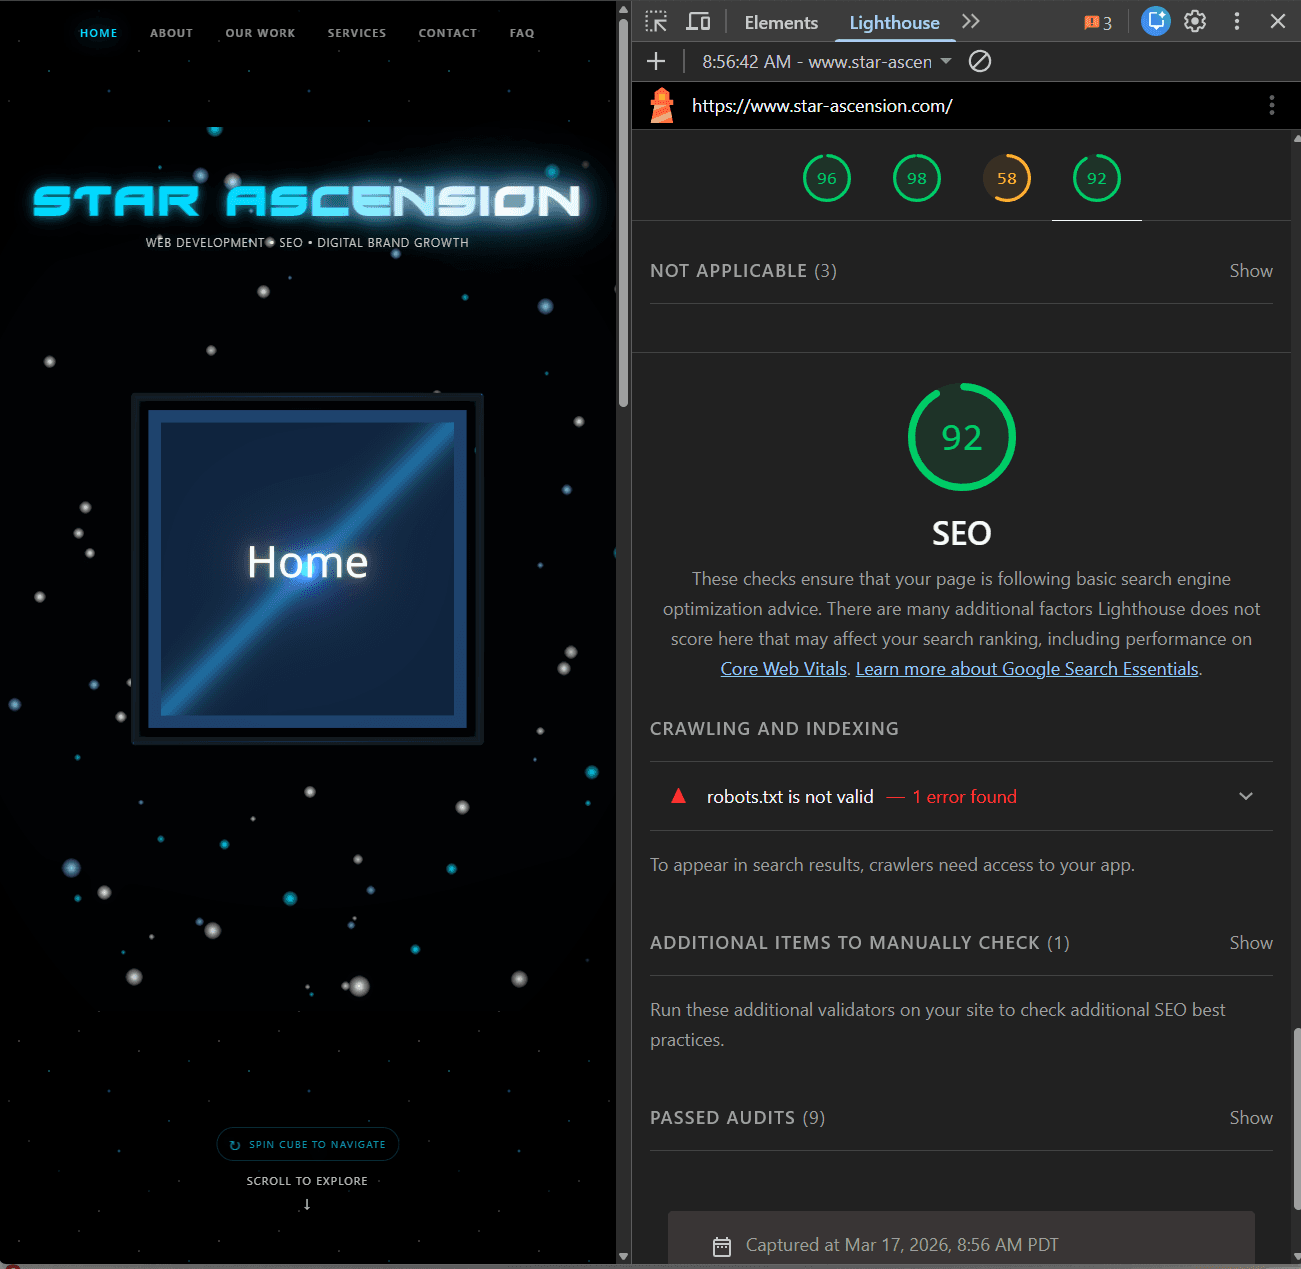
Here's why I'm writing this. When I audited this site, the SEO score was 92. Perfectly fine. But I wanted 100. The report said one thing: "robots.txt is not valid."
I opened our code. The robots.ts file was clean. No errors. I checked line 29, where Lighthouse said the problem was. Nothing unusual. Just normal directives.
Then I noticed something I didn't write. When I viewed the live robots.txt file in the browser, there was an extra line:
Content-Signal: search=yes,ai-train=no
This wasn't in our code. It wasn't in our deployment. So where was it coming from?
Well it turns out, it was our good friend Cloudflare. Cloudflare routes traffic for our domain, and they have a feature called AI Crawl Control. It automatically appends this Content-Signal directive to your robots.txt to tell AI crawlers whether they can train on your content. The problem? Content-Signal isn't part of the official robots.txt specification. It's a custom thing Cloudflare made up. Lighthouse follows the spec strictly, so it flagged it as invalid.
 Tap to expand
The fix was simple once I found it. Log into your Cloudflare dashboard. Go to Security or Bots. Find AI Crawl Control. Turn off the "Managed robots.txt" feature. Cloudflare stops injecting that line, and your Lighthouse SEO score jumps back to 100 the next time Google crawls your site. I, however left it in. I like Cloudflare's security features.
7. Important Context That's Worth Mentioning
Here's the thing I learned: that Content-Signal directive doesn't actually break anything. Google and Bing just ignore robots.txt lines they don't recognize. This site was being crawled and indexed correctly the entire time. The 92 score was purely cosmetic.
But Lighthouse is strict. It follows the rules exactly, which is actually why it's useful. It catches things you'd never notice by just looking at your site, even when those things come from third-party services instead of your own code.
8. Suggested Next Steps
Run Lighthouse regularly. I do it after every deploy now, and definitely after changing anything with DNS or CDN services like Cloudflare. A score drop almost always points to something specific and fixable, even if you don't know where the problem started.
Hope this saves you the afternoon I lost to that robots.txt rabbit hole. And now to figure out what's causing that score of 58 for "Best Practices"... 🤔
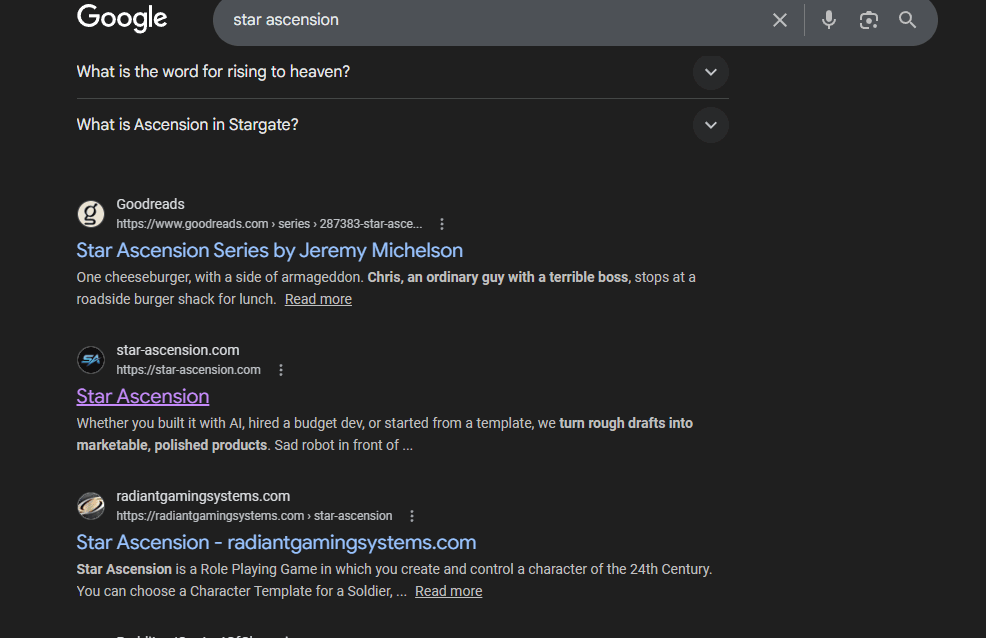
I want to tell you about a bug I found on my own site this week. I Googled "star ascension" to see how we were showing up in search results, and there it was on page one. Great, right? Then I read the description Google was showing under our link:
"Whether you built it with AI, hired a budget dev, or started from a template, we turn rough drafts into marketable, polished products. Sad robot in front of..."
 Tap to expand
Sad robot in front of. That's not our meta description. That's the alt text from an image on our landing page. Google had ignored the meta description I wrote and was building its own snippet by stitching together body text and image alt attributes. That's embarrassing, and it's exactly the kind of thing that makes people scroll past your link in search results.
So let me walk you through what meta tags are, how to write them properly, and how I fixed this.
1. What Are Meta Tags?
Meta tags are invisible HTML elements in the head of your page that tell search engines and social platforms what your page is about. Users never see them directly, but they control the title, description, and preview image that show up in Google results, link previews on social media, and browser tabs. If you've ever shared a link on Twitter or iMessage and seen a nice preview card with a title, description, and image, that's meta tags at work. If you've shared a link and it looked like a bare URL with no context, that's missing meta tags.
2. The Title Tag
This is the blue clickable text in Google search results. It's also what shows up in your browser tab. For SEO, this is the single most important on-page element.
Rules for a good title tag:
- Keep it under 60 characters (Google truncates longer titles with "...")
- Put your primary keyword near the front
- Make it specific to the page, not generic
- Include your brand name, usually at the end after a separator
Bad: "Home | My Website"
Good: "Custom Web Development & SEO Services | Star Ascension"
Each page should have a unique title. Your homepage title should be different from your FAQ page title, which should be different from your contact page title. If Google sees the same title on every page, it doesn't know which page to show for a given query.
3. The Meta Description
This is the gray text under the blue title in Google results. Google uses it as a "suggested snippet" but reserves the right to ignore it and build its own from your page content if it thinks its version is more relevant to the search query.
Rules for a good meta description:
- Aim for 150 to 160 characters. Too short and Google will substitute its own version. Too long and it gets truncated.
- Include your target keyword naturally
- Write it like ad copy. This is your pitch to convince someone to click your link instead of the other nine results on the page.
- Don't stuff it with keywords. Google can tell, and users can tell.
- Make it specific to the page content
Bad (too short, 80 chars): "Elevating Your Apps to New Heights - Web Development, SEO & Digital Brand Growth"
Good (155 chars): "Custom web development, SEO, and digital marketing for small businesses. We turn rough drafts into polished products. Free consultation available."
That first example? That was the actual meta description. Eighty characters of vague branding. No wonder Google decided it could do better.
4. Open Graph Tags (Social Previews)
Open Graph tags control how your link looks when shared on Facebook, LinkedIn, Twitter, iMessage, Slack, and Discord. Without them, shared links show up as plain URLs or with random text pulled from your page.
The key Open Graph tags:
- og:title: The title shown in the preview card
- og:description: The description in the preview card
- og:image: The preview image (1200x630 pixels is ideal)
- og:url: The canonical URL for the page
- og:type: Usually "website" for homepages, "article" for blog posts
Twitter has its own version (twitter:card, twitter:title, etc.) but most platforms now fall back to Open Graph if Twitter-specific tags aren't present.
5. The "Sad Robot" Bug: What Went Wrong
Here's what happened on our site. Our meta description was "Elevating Your Apps to New Heights - Web Development, SEO & Digital Brand Growth." That's only about 80 characters. Google looked at that, decided it was too generic, and built its own snippet.
To build its snippet, Google crawls the visible text on your page. It grabbed the most descriptive paragraph it could find, which happened to be our value proposition: "Whether you built it with AI, hired a budget dev, or started from a template, we turn rough drafts into marketable, polished products."
Then it kept going. The next piece of "text" it found was the alt attribute on our first image: "Sad robot in front of programmer looking at laptop with magnifying glass." Google treats alt text as page content because that's exactly what alt text is for. It describes the image. And if that description happens to be sitting right next to your value proposition in the DOM, Google might stitch them together into one snippet.
The fix had two parts:
- Write a better meta description that's 150 to 160 characters, specific, and keyword-rich so Google actually uses it
- Review image alt text to make sure it's still descriptive for accessibility but written with the awareness that Google reads it as page content
This doesn't mean you should stuff keywords into alt text. Alt text exists for screen readers and accessibility. But it does mean you should avoid writing alt text that would look absurd in a search result. "Sad robot in front of programmer" is fine as alt text, but it's not something you want Google to show as your business description.
6. How to Set This Up in Next.js
If you're using Next.js App Router, metadata is straightforward. Each page can export a metadata object with all the tags you need. The framework handles rendering them into the HTML head.
7. Structured Data (Schema.org)
Beyond basic meta tags, structured data gives Google even more context. Schema.org markup in JSON-LD format tells Google explicitly: "This page is a FAQ page with these questions and answers" or "This page is an article published on this date by this author."
For FAQ pages, this can get your answers displayed directly in Google search results as expandable dropdowns, which dramatically increases visibility and click-through rate. We use FAQPage schema on this site, and you're reading the content that's marked up with it right now.
8. Common Mistakes
- Same meta description on every page (Google ignores duplicate descriptions)
- Missing Open Graph tags (your links look terrible when shared)
- Meta description that's a list of keywords instead of a readable sentence
- Title tags that are just your company name with no context
- Forgetting to set different metadata for each page
- Writing alt text without considering that Google reads it as visible content
9. Quick Checklist
For every page on your site, check these boxes:
- Unique title tag under 60 characters with primary keyword
- Unique meta description between 150 and 160 characters
- Open Graph title, description, and image
- Canonical URL pointing to the preferred version of the page
- Image alt text that's descriptive but wouldn't look weird in a search result
- Schema.org structured data if applicable (FAQ, Article, Product, etc.)
Google Search Console's URL Inspection tool will show you exactly what Google sees for any page. Use it after making changes to verify your tags are rendering correctly.
This one cost me some pride, but finding "Sad robot in front of..." in our Google listing was the push I needed to actually fix our metadata across the whole site. Sometimes the best lessons come from your own mistakes showing up in public. Good thing we don't get many visitors at this point 😉
Every small business needs a professional email address. Sending proposals from yourname@gmail.com works when you're starting out, but the moment a potential client sees yourname@yourdomain.com, your business looks more established. The problem is that every email hosting provider wants to charge you for it. Google Workspace is $7 per month. Microsoft 365 is $6 per month. Godaddy was asking for $2 a month. If you're anything like me, then you like to do things as cheap as possible.
And lucky you, I will tell you how I set up johnwintz@star-ascension.com without paying anything. I can send and receive emails from this address directly inside my personal Gmail account. No separate inbox. No switching between accounts (Sort of, you'll see how this works). No monthly bill.
The setup uses four free tools working together:
- **Nodemailer** - Sends emails from your website's contact form
- **SMTP2GO** - Free SMTP relay service (1,000 emails/month on the free plan)
- **Cloudflare Email Routing** - Receives emails at your domain and forwards them to Gmail
- **Gmail "Send mail as"** - Lets you compose and reply from your company address inside Gmail
Let me walk through each piece.
Step 1: Set Up Nodemailer for Your Contact Form
If you're running a Next.js site or any Node.js backend, Nodemailer is the standard library for sending emails programmatically. We use it for the contact form on this site. The setup is straightforward: create a transport with SMTP credentials, compose a message, and send it.
The code snippet below shows our actual contact form API route. The important fields are host, port, and auth. These credentials come from your SMTP provider, which leads us to Step 2. If you tried using Gmail's built-in SMTP to send these, you'd hit sending limits quickly and Google might flag your account for suspicious activity. That's where SMTP2GO comes in.
Step 2: Create an SMTP2GO Account
SMTP2GO is an email delivery service with a generous free tier: 1,000 emails per month. For a small business contact form, that's more than enough. The setup is a bit involved because you need to verify your domain ownership by adding DNS records, but it's not too bad.
Here's the process:
// src/app/api/contact/route.ts - Contact form with Nodemailer + SMTP2GO

import nodemailer from 'nodemailer';

// Create transporter with SMTP2GO credentials
const transporter = nodemailer.createTransport({
  host: 'mail.smtp2go.com',
  port: 587,
  secure: false,
  auth: {
    user: process.env.SMTP_USER,     // Your SMTP2GO username
    pass: process.env.SMTP_PASS,     // Your SMTP2GO password
  },
});

// In your API route handler:
const mailOptions = {
  from: '"Star Ascension Contact" <johnwintz@star-ascension.com>',
  to: 'johnwintz@star-ascension.com',
  replyTo: clientEmail,
  subject: `New Inquiry from ${clientName}`,
  html: emailTemplate,
};

// Send using .then() chain
transporter
  .sendMail(mailOptions)
  .then(() => {
    return NextResponse.json({ success: true });
  })
  .catch((error) => {
    console.error('Email send failed:', error.message);
    return NextResponse.json(
      { error: 'Failed to send email' },
      { status: 500 }
    );
  });
1. Go to smtp2go.com and create a free account
2. In the dashboard, go to Sending > Verified Senders
3. Add your domain (star-ascension.com in my case)
4. SMTP2GO will give you DNS records to add: an SPF record and DKIM records
5. Add these records in your DNS provider (Cloudflare, Namecheap, etc.)
6. Wait for verification (usually takes a few minutes, sometimes up to 48 hours)
7. Once verified, go to Settings > SMTP Users and create an SMTP user
8. Save your credentials somewhere safe
Your SMTP credentials will be:
- Host: mail.smtp2go.com
- Port: 2525 (or 587, or 465 for SSL)
- Username: your SMTP2GO username
- Password: your SMTP2GO password
These are the values you plug into Nodemailer's transporter config, and also what you'll use for the Gmail alias setup in Step 4.
The DNS verification step is critical. Without SPF and DKIM records, emails sent from your domain will land in spam folders or get rejected entirely. These records prove to receiving mail servers that you're authorized to send email from your domain. SMTP2GO provides the exact records you need and walks you through adding them.
Step 3: Set Up Cloudflare Email Routing
Now you can send emails from your domain, but you can't receive them yet. If someone replies to a message you sent from johnwintz@star-ascension.com, or sends you a cold email at that address, it goes nowhere. I went with Cloudfare for the free Email Routing feature which fixes this by forwarding emails from your domain to any personal email address. You're website should have a CDN regardless, and Cloudfare's free tier is pretty great.
Here's your walkthrough:
1. Your domain needs to be on Cloudflare (if you're already using Cloudflare for DNS, you're set)
2. In the Cloudflare dashboard, go to your domain > Email > Email Routing
3. Click "Get started" if this is your first time
4. Add a custom address: the email you want to use (e.g., johnwintz@star-ascension.com)
5. Set the destination to your personal Gmail address
6. Cloudflare will add the necessary MX records to your DNS automatically
7. Check your Gmail for a verification email from Cloudflare and click the confirmation link
That's it for receiving. Any email sent to johnwintz@star-ascension.com now arrives in my Gmail inbox alongside all my personal email. No separate login required.
Step 4: Set Up a Gmail Alias
You'll need a gmail account for this part, obviously. Right now you can receive company emails in Gmail now, but when you hit "reply," Gmail still sends from your personal address. The fix is Gmail's "Send mail as" feature, which lets you compose and reply using your company email without ever leaving Gmail.
Here's the setup:
1. Open Gmail and click the gear icon, then "See all settings"
2. Go to the "Accounts and Import" tab
3. Find "Send mail as" and click "Add another email address"
4. Enter your name and company email address (e.g., johnwintz@star-ascension.com)
5. Keep "Treat as an alias" checked
6. On the next screen, enter your SMTP2GO credentials:
- SMTP Server: mail.smtp2go.com
- Port: 587
- Username: your SMTP2GO username
- Password: your SMTP2GO password
7. Click "Add Account"
8. Gmail sends a confirmation code to your company email
9. Since Cloudflare is already routing that address to your Gmail, the confirmation arrives in your inbox immediately
10. Enter the code and you're done
Now when you compose a new email in Gmail, you'll see a "From" dropdown that lets you choose between your personal address and your company address (if not click the recipients email). When you reply to an email that was sent to your company address, Gmail automatically uses that address for the reply.
The Complete Flow:
- A client emails johnwintz@star-ascension.com
- Cloudflare catches it and forwards it to my personal Gmail
- I see it in my inbox like any other email
- I hit reply, and Gmail sends the response from johnwintz@star-ascension.com via SMTP2GO
- The client sees a professional company email address, not a Gmail address
- Meanwhile, the contact form on the website also sends through the same SMTP2GO relay via Nodemailer
Everything uses one set of SMTP credentials, runs through one Gmail inbox, and the total monthly cost is zero.
What You're Saving:
- Google Workspace: $7/month ($84/year)
- Microsoft 365: $6/month ($72/year)
- This setup: $0/month ($0/year as long as you stay in the free tiers for Cloudflare and SMTP2GO)
For a solo founder or small team, there's no reason to pay for email hosting until you outgrow SMTP2GO's free tier or need features like shared calendars and Google Drive storage. By that point, your business should be generating enough revenue that $7 per month is pocket change.
Things to Keep in Mind:
- SMTP2GO's free tier caps you at 1,000 emails per month. If you're sending newsletters or bulk email, you'll need a dedicated email marketing tool like Mailchimp or ConvertKit alongside this setup.
- This works best for one person or a small team where everyone's email can forward to one inbox. For a team that needs separate inboxes with shared calendars, Google Workspace is worth the cost.
- Make sure your SPF, DKIM, and DMARC records are all configured correctly. Bad DNS records mean your emails land in spam. SMTP2GO and Cloudflare both guide you through this.
- Test the full loop before going live. Send an email to your company address from a different account, verify it arrives in Gmail, reply from the alias, and confirm the recipient sees your company address as the sender.
I know, I know... another generic top random number list. But I was short on time this week and these tips come straight from Google's own documentation. If you want to hear what the search engine itself recommends, here it is.
1. Know What Your Audience Is Actually Searching For
Before writing a single word, do keyword research. Find out the exact words and phrases your potential customers type into Google, then build your content around those terms. Write for people first, Google second.
2. Create Content That Is Genuinely Useful
Google rewards content that people actually want to read, watch, or share. If your content is helpful, clear, and well-written (with no typos!), you are already ahead of most of the competition.
3. Study Your Competition
To rank higher than your competitors, you first have to understand what they are doing. Look at the pages that are already ranking for your target keywords. Could you write something more in-depth, add a helpful video, or make a more concise version? You cannot beat the competition without knowing what you are up against.
4. Get Other Reputable Websites to Link to You
Think of links from other sites as votes of confidence. The more credible websites that point to yours, the more Google trusts you. Great content naturally earns links over time.
5. Have Real Experts Behind Your Content
Google looks for signs of genuine expertise and trustworthiness. Make sure content on your site is written or reviewed by people who actually know the subject. A knowledgeable editor reviewing your work goes a long way.
6. Organize Your Website Like a Clean Filing Cabinet
A logical, hierarchical site structure helps Google find all your pages. Think: Homepage > Category > Subcategory > Product. Easy navigation also keeps visitors from leaving in frustration. And if a page no longer exists, show a helpful 404 error page with links back to useful content rather than a dead end.
7. Use HTTPS (The Padlock in Your Browser)
Make sure your website address starts with https:// instead of http://. It protects your visitors' data and Google gives a small ranking boost to secure sites.
8. Write Unique Titles and Descriptions for Every Page
Each page on your site should have its own title and short summary (called a meta description). These are what people see in Google search results before they click, so make them accurate and interesting.
9. Make Your Site Fast
Page speed is a direct ranking factor. Images are usually the biggest culprit. Use Google's free PageSpeed Insights tool to find out what is slowing your site down and fix the biggest offenders first.
10. Make Your Site Work Great on Mobile
Google checks how your site looks and works on a phone. If it is hard to use on a small screen, your rankings will suffer. A mobile-friendly site is no longer optional. Together, speed and mobile usability make up what Google calls the "page experience" ranking factor, and it matters as much as your content.
11. Add Structured Data to Stand Out in Search Results
Structured data is a snippet of code that tells Google extra details about your page, like product prices, star ratings, or video content. This can unlock rich, eye-catching results in Google search that get more clicks.
12. Use Google Search Console (It Is Free)
This free tool from Google shows you how many people find your site, which pages are performing well, any errors Google found, and whether your site has security issues. Check it regularly and fix problems as they come up.
Google Search Console is a free tool that gives you insights into how your website is performing in Google search. It's also been the bane of my existence these past couple weeks as I have been struggling to figure out how page indexing actually works. We'll get more into that with next weeks article. As I write this I'm not entirely sure my solution to my problem is correct. SEO takes time and patience and apparently lots of trial and error... Or maybe I'm just overcomplicating things. Back to the drawing board! Google Search Console shows you which keywords are driving traffic, which pages are ranking, and any issues Google has with crawling or indexing your site. Here's how to set it up and use it effectively.
1. Set Up Your Account
Go to search.google.com/search-console and sign in with your Google account. Click "Add property" and enter your website URL. You can choose between "Domain" (which covers all subdomains and protocols) or "URL prefix" (which is specific to one version of your site). Follow the verification steps, which usually involve adding a DNS record or uploading an HTML file to your server.
2. Submit Your Sitemap
A sitemap is a file that lists all the pages on your site. It helps Google discover and index your content. If you're using Next.js, you can generate a sitemap automatically with a package like next-sitemap. Once you have your sitemap URL (e.g., https://yourdomain.com/sitemap.xml), go to the "Sitemaps" section in Search Console and submit it.
3. Monitor Performance
The "Performance" report shows you which search queries are bringing people to your site, which pages are ranking, and how many clicks and impressions you're getting. Use this data to see what's working and where you can improve. Look for keywords that have a lot of impressions but low click-through rates, as those might be opportunities to optimize your titles and descriptions.
4. Check for Errors
The "Coverage" report shows you any issues Google has with crawling or indexing your pages. If you see errors like "Submitted URL not found (404)" or "Server error (5xx)," investigate and fix those pages. A high number of errors can hurt your SEO.
5. Mobile Usability
The "Mobile Usability" report checks if your site works well on mobile devices. It flags issues like text that's too small, clickable elements that are too close together, or content that is wider than the screen. Fixing these issues can improve your rankings since mobile-friendliness is a ranking factor.
6. Security Issues
If Google detects any security problems on your site, such as malware or hacked content, it will show up in the "Security Issues" report. Address these immediately to protect your visitors and maintain your search rankings.
7. Use the URL Inspection Tool
This tool lets you check how Google sees a specific page on your site. You can see if it's indexed, if there are any crawl errors, and how it renders the page. It's useful for troubleshooting specific pages that aren't performing well.
8. Set Up Email Alerts
In the settings, you can choose to receive email notifications for critical issues like indexing errors or security problems. This way, you can stay on top of any problems that arise without having to check Search Console constantly.
By regularly monitoring Google Search Console, you can keep your site healthy, optimize for better performance in search results, and quickly address any issues that could hurt your SEO.
Google Analytics 4 (GA4) is Google's free analytics platform and the successor to Universal Analytics, which Google officially sunset on July 1, 2023. If you still have UA running somewhere, it stopped collecting data years ago. GA4 is now the default, and honestly, it's a significant upgrade. It tracks users across devices, measures events instead of pageviews by default, and integrates cleanly with Google Ads, Search Console, and BigQuery. Best of all, it's free for most small businesses.
I've been using GA4 since day one on this site and it has already paid for itself in the amount of insight it gives me (well, it's free, so I guess it paid me). Below is exactly how I set it up, how the tracking code gets added to a Next.js site, and a few real ways I use the data every week.
Step 1: Create a GA4 Property
Head over to analytics.google.com and sign in with your Google account. If this is your first time, Google will walk you through creating an Account (usually named after your business) and a Property (your website). A property is the bucket where all your traffic data lives.
When creating the property:
1. Enter your business name, reporting time zone, and currency
2. Pick your industry category and business size (this just tailors the default dashboards)
3. Choose your business objectives (generate leads, drive online sales, etc.) so GA4 can recommend relevant reports
4. Accept the terms of service
Once the property is created, Google will prompt you to set up a data stream. Choose "Web," enter your site URL, and give the stream a name. GA4 will generate a Measurement ID that looks like G-XXXXXXXXXX. Save this somewhere safe, you're about to paste it into your code.
Step 2: Add the Tracking Tag to Your Site
There are two common ways to install GA4: the gtag.js snippet directly, or through Google Tag Manager. For a simple site, gtag.js is fine and that's what I use here. If you need to manage multiple tags (Facebook Pixel, LinkedIn Insight Tag, etc.), Google Tag Manager is worth the extra setup, but it's overkill for most small businesses.
The gtag.js snippet Google gives you looks like this:
For a Next.js site using the App Router, don't paste the raw script tag into your layout. Use the built-in next/script component so Next.js can optimize when and how the script loads. Place the Measurement ID in an environment variable (I use NEXT_PUBLIC_GA_ID) so it never ends up hardcoded in your source.
After adding the tag, deploy your site and open it in a browser. In GA4, go to Reports > Realtime. You should see yourself appear as an active user within about 30 seconds. If nothing shows up after a few minutes, use the Tag Assistant Chrome extension to verify the tag is firing.
Step 3: Link GA4 to Google Search Console
<!-- Google tag (gtag.js) -->
<script async src="https://www.googletagmanager.com/gtag/js?id=G-XXXXXXXXXX"></script>
<script>
  window.dataLayer = window.dataLayer || [];
  function gtag(){dataLayer.push(arguments);}
  gtag('js', new Date());

  gtag('config', 'G-XXXXXXXXXX');
</script>
This step is optional, but I'd highly recommend it. Linking GA4 to Search Console unlocks an extra section in GA4 called "Search Console" with two reports: Queries and Google Organic Search Traffic. These show you which search queries are landing on your site and how those visitors behave once they get there. Without the link, GA4 only sees sessions. With it, you can connect the organic search query to actual user behavior.
To link them:
1. In GA4, go to Admin > Product Links > Search Console Links
2. Click "Link" and choose your verified Search Console property
3. Select the web data stream you created in Step 1
4. Review and submit
Give it 48 hours for data to start flowing. Once connected, you'll see the Search Console reports under Reports > Search Console in the left sidebar.
Step 4: Set Up Key Events (Conversions)
In GA4, "key events" are what Universal Analytics called "conversions." They're the things you actually care about: contact form submissions, quote requests, newsletter signups, purchases. You mark events as key events inside GA4 so they show up in your conversion reports and can be imported into Google Ads for campaign optimization.
GA4 tracks a lot of events automatically (page_view, scroll, click, first_visit, session_start), but the meaningful ones usually need custom events. On this site, the contact form fires a custom event called contact_form_submit every time a message goes through. Here's how to set that up:
1. In your code, fire a gtag event when the action happens: gtag('event', 'contact_form_submit', { value: 1 });
2. In GA4, go to Admin > Events and wait for the event to appear (can take up to 24 hours for new events)
3. Toggle "Mark as key event" next to the event name
4. Your key event now appears in Reports > Engagement > Conversions
Using the value parameter is useful for events that have an estimated monetary value (like a lead worth $50 to your business). GA4 will sum those up for you in reports.
How I Actually Use GA4 Every Week
Setting up GA4 is the easy part. The real value is in actually looking at the data. Here are the three reports I find useful for Star Ascension, along with what each one tells me.
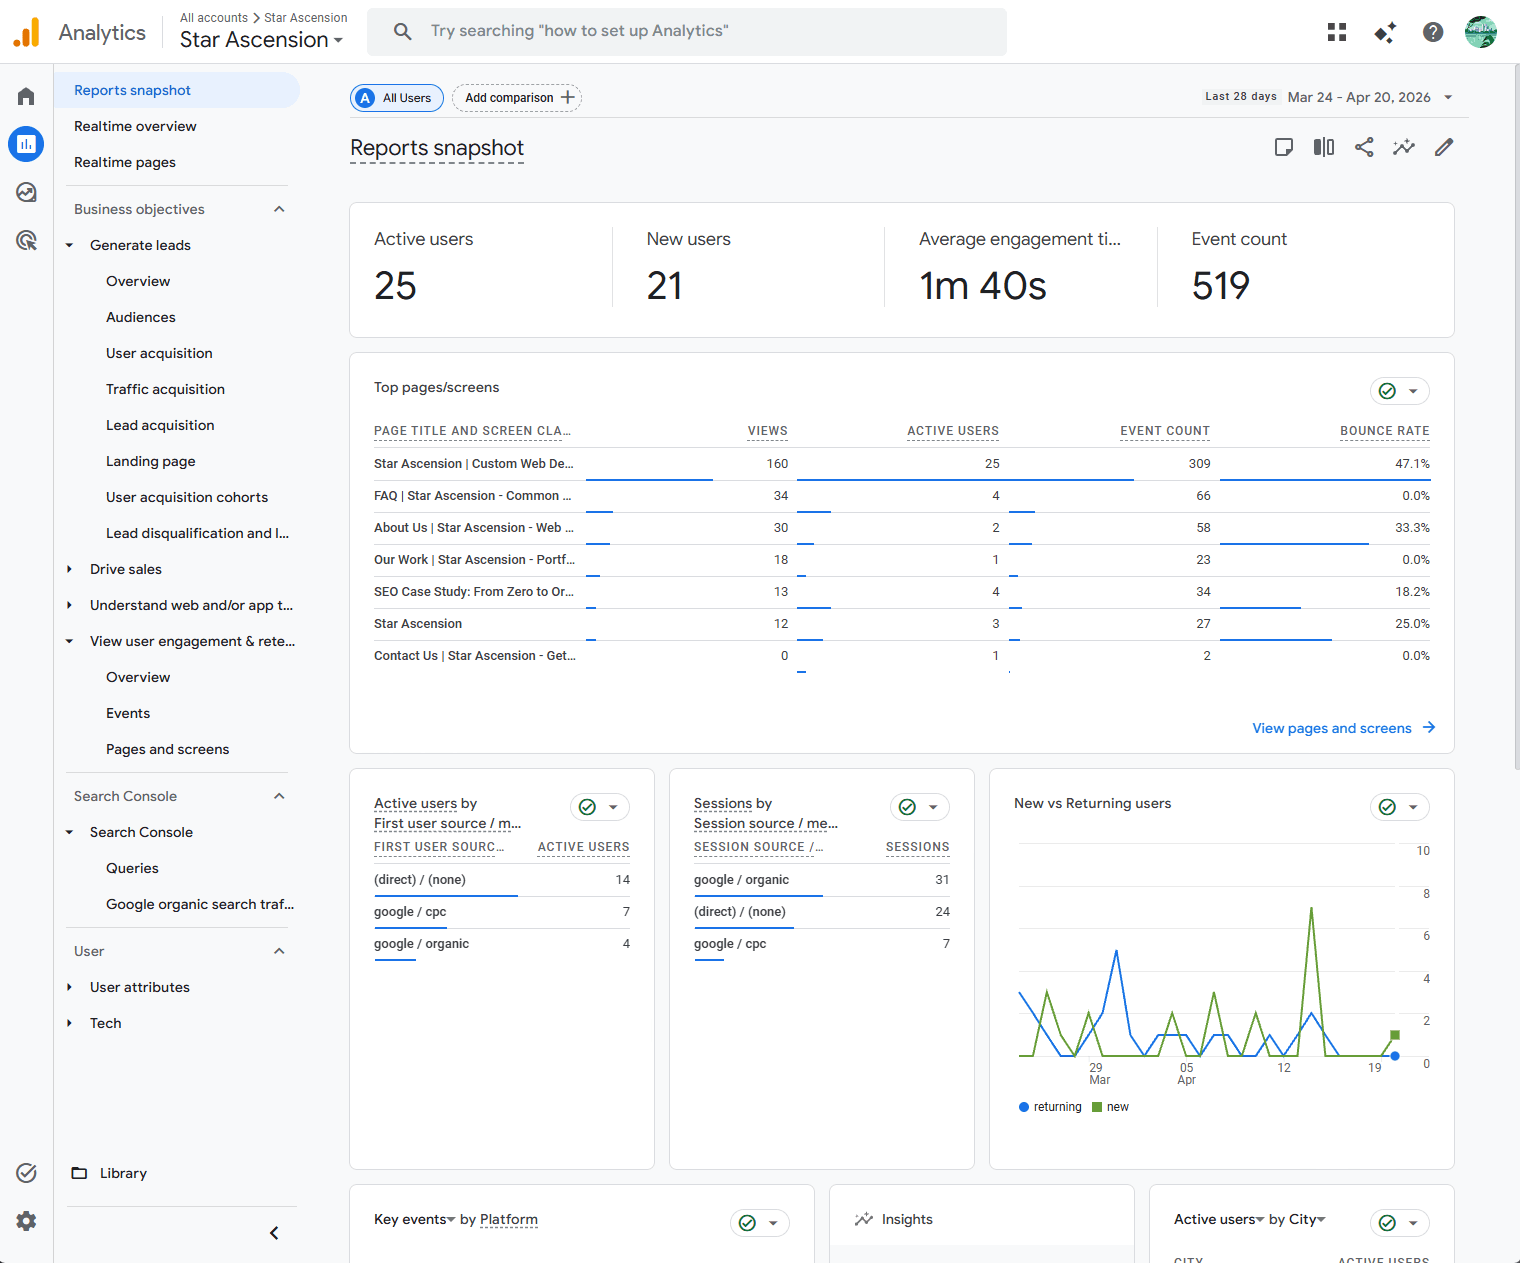
**The Reports Snapshot** gives me a 28-day overview in one page: active users, new users, average engagement time, and event count. Right below that is the Top pages/screens card, which shows me which pages are actually pulling their weight. Over the last 28 days, the homepage received 160 views, the FAQ page 34 views with a 0% bounce rate, and the case study 13 views with 18.2% bounce. That tells me FAQ traffic is highly engaged, which is the whole point of the SEO experiment I'm running.
The report also shows traffic acquisition broken down by source. For me, that's google/organic 14 users, direct 4, and google/cpc 7. Seeing the split between organic and paid in one view lets me know whether the FAQ content strategy is actually growing organic traffic or if the numbers are inflated by a small ad test I ran.
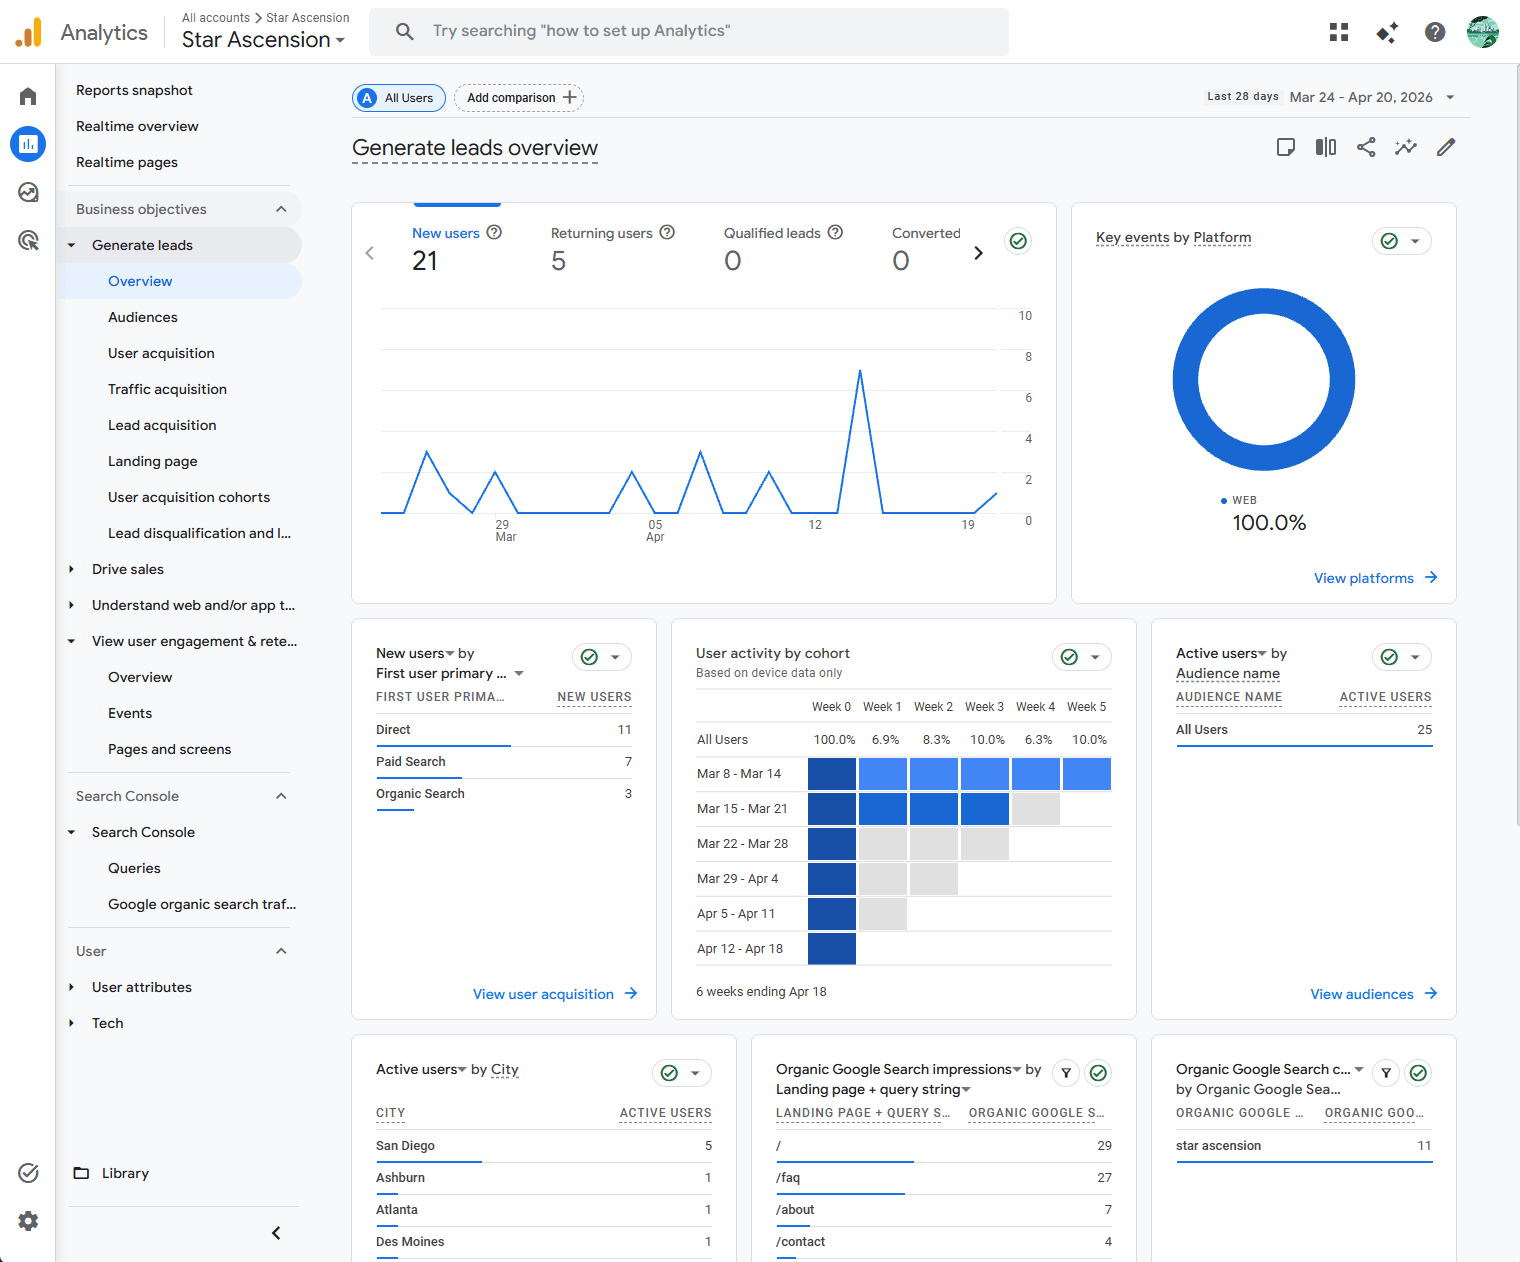
**The Generate Leads Overview** is under Business Objectives in the left sidebar. This is where GA4 gets genuinely useful for a services business. The headline metric is qualified leads and converted leads, but the breakdowns underneath tell the real story. New vs returning users, user activity by cohort (showing retention week over week), and active users by city are all right here. Mine shows 21 new users and 5 returning, with top cities San Diego, Ashburn, Atlanta, and Des Moines. The cohort retention grid is a quick gut check of whether people are actually coming back.
Scroll down further on the same report and you'll find "Organic Google Search impressions by Landing page + query string." This is similar data to Search Console but inside GA4, so you can cross-reference it with user behavior. Right now the homepage has 29 impressions, /faq has 27, /about has 5, and /contact has 4. That near-tie between the homepage and the FAQ page is exactly the hypothesis I'm testing: can FAQ content pull its weight as a traffic source without any advertising?
**The Realtime Report** is mostly for gut checks. Deployed a change? Open Realtime and make sure the tag still fires. Running a campaign? Watch users stream in live. It's also the fastest way to verify GA4 is still working after you push new code.
Common Setup Mistakes to Avoid
A few things I had to debug the first time I set GA4 up, so you don't have to:
 Tap to expand
1. **Your own traffic inflating numbers.** In GA4, go to Admin > Data Streams > your stream > Configure tag settings > Show more > Define internal traffic. Add your home IP (Google "what is my IP" to find it). Then go to Admin > Data Filters and activate the internal traffic filter. Without this, you'll skew your own stats by testing the site.
2. **No data after 24 hours.** Usually means the tag isn't firing. Check Realtime first. If that's empty, open DevTools > Network and filter for "collect" while loading the site. If no requests go out, the tag isn't installed correctly.
3. **Forgetting to mark key events.** Events that aren't marked as key events still get tracked, but they won't show up in conversion reports or be importable into Google Ads. Every time you add a new meaningful event, go back and mark it.
4. **Not linking Search Console and Google Ads.** Both are free and both give you more data inside GA4. There's no reason not to link them once you have the accounts.
GA4 took me a few days to get comfortable with (the UI is very different from Universal Analytics) but once it's set up it runs on its own. Check it once a week, track the numbers that actually matter for your business, and let the data guide what content you write next.
 Tap to expand
If you've ever opened Google Search Console and seen one of your pages stuck in the "Redirect error" bucket of the Page indexing report, you know how unhelpful that error message is. Google tells you the URL won't be indexed because of a redirect problem, but it doesn't tell you which redirect, how many hops, or why it failed. I spent the last two weeks chasing this exact issue on my own site and the answer turned out to be a single subtle Cloudflare configuration mistake. I want to walk through exactly how I diagnosed it, what the fix was, and how to do the same thing on your own site in about 15 minutes.
What happened wasgit push Google Search Console reports "Redirect error" when it follows a chain of redirects that has too many hops, mixes status codes, or eventually hits a non-2xx response. In my case the homepage at https://star-ascension.com was bouncing through two 301s before landing on the canonical https://www.star-ascension.com, and that two-hop chain was just enough to flip Google from "fine, alternate canonical" into "error, won't index."
Step 1: Find the offending URL in Google Search Console
Go to Indexing > Pages in the left sidebar. Scroll past the "Indexed" and "Not indexed" totals to the "Why pages aren't indexed" table. If you have a Redirect error entry, click it. GSC will show you up to 1,000 example URLs that hit the error, plus the date Google last tried to crawl them. Mine showed exactly one URL: the bare apex domain without the www prefix.
In my case, the row also showed a previous "Validate Fix" attempt that had been kicked off, ran for four days, and reported "Validation failed" on April 24. That's GSC's way of saying it re-crawled the URL on the date listed in the table and the redirect chain still looked broken to its bots.
Take note of the example URL. You'll need it in the next step.
Step 2: Check the redirect chain with curl
This is the trick that saved me a ton of time. Open a terminal and run a single command to see exactly what your server returns when something asks for that URL:
The flags do three things: -s silences progress output, -I sends a HEAD request so you only get headers back, and -L follows redirects. Piping it through grep filters down to just the HTTP status lines and Location headers. The result is a clean stack trace of every hop a crawler would take.
Here's what mine looked like before the fix:
# Send a HEAD request and follow every redirect, then filter
# down to just status codes and Location headers
curl -sIL "http://your-domain.com/" | grep -iE "HTTP/|location:"

# Test a few variants
curl -sIL "https://your-domain.com/" | grep -iE "HTTP/|location:"
curl -sIL "http://your-domain.com/faq" | grep -iE "HTTP/|location:"
curl -sIL "http://www.your-domain.com/" | grep -iE "HTTP/|location:"
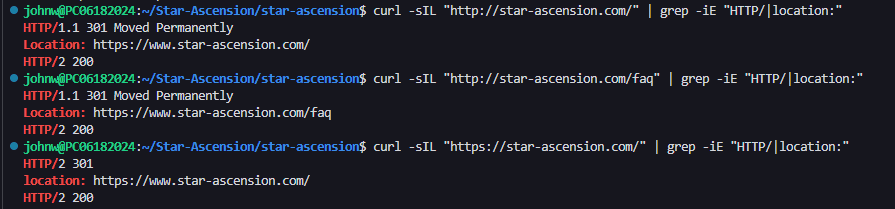
What this told me: Google asked for http://star-ascension.com, which Cloudflare's "Always Use HTTPS" rule answered with a 301 to https://star-ascension.com. Then my non-www to www redirect fired and answered with a second 301 to https://www.star-ascension.com. Two hops, then the actual page. Two 301 hops on the same crawl is not strictly disallowed, but it's the most common cause of GSC's redirect error when paired with anything else slightly off (a sitemap that lists the non-www host, a property type mismatch, or any temporary Cloudflare behavior).
Step 3: Identify which rule is adding the extra hop
In Cloudflare, two settings can independently produce a redirect:
 Tap to expand
1. **SSL/TLS > Edge Certificates > Always Use HTTPS** is the toggle that promotes any http:// request to https:// on the same host
2. **Rules > Redirect Rules** is where your custom non-www to www (or any other) redirect lives
If you have both turned on and your Redirect Rule's pattern only matches https:// (which is the default when you use a Wildcard pattern that starts with https://), then any http:// request gets the SSL toggle redirect first, then the rule fires on the second pass. Which is the chain causing our extra 301 hop. My Cloudflare Single Redirect was set up exactly this way, with a Wildcard pattern of https://star-ascension.com/* and a 301 target of https://www.star-ascension.com/${1}. Which happened to be the wrong matcher for the http:// case.
Step 4: Fix the rule with a Custom filter expression
The cleanest fix is to switch the rule's matcher from Wildcard pattern to Custom filter expression so it catches both schemes in one shot.
In Cloudflare, go to Rules > Redirect Rules, edit the existing non-www to www rule, and configure it like this:
- **When incoming requests match:** Custom filter expression
- **Expression:** `(http.host eq "your-domain.com")` (use the non-www host)
- **Then:** Dynamic redirect
- **Expression:** `concat("https://www.your-domain.com", http.request.uri.path)`
- **Status code:** 301 Permanent Redirect
- **Preserve query string:** on
- **Place at:** First
I found the most important change is using http.host instead of a URL pattern. http.host matches the hostname regardless of scheme, so a request that arrives as either http://your-domain.com/anything or https://your-domain.com/anything will be caught by this same rule and redirected directly to https://www in a single hop. Cloudflare's Always Use HTTPS toggle never gets a chance to fire on the apex because your custom rule runs first.
Leave Always Use HTTPS turned on. It still handles the http://www.your-domain.com to https://www.your-domain.com case, which is what you want.
Step 5: Verify with curl again
Run the same curl commands you ran in Step 2 and look for exactly one 301 per request. Here's mine after the rule change:
Your main objective should be one 301 hop per request, landing on the canonical URL with the path preserved, regardless of whether the visitor (or Googlebot) started at http or https, with or without the www prefix. Test a few different paths (root, a deep page, something with a query string) just to make sure the dynamic concat is preserving paths correctly.
Step 6: Tighten your robots.txt and sitemap
While you're at it, check that your robots.txt is only advertising the canonical sitemap URL. I had the non-www version listed too, which was forcing Google to crawl that extra hostname directly:
If your sitemap.ts (Next.js) or sitemap.xml lists the canonical hostname only and your robots advertises only that canonical sitemap URL, Google has no reason to ever follow the non-www redirect chain on its own. The single 301 you set up in Step 4 is just there as a safety net for organic links and old indexed URLs.
Step 7: Re-validate in Google Search Console (and wait)
Back in GSC, open Indexing > Pages > Redirect error and click "Validate Fix" again. Validation can take up to 28 days, but in my experience the first re-crawl happens within 4 to 7 days. While you wait, do not click Validate Fix repeatedly: each failed validation makes Google slightly more conservative about how often it re-checks.
You can also use the URL Inspection tool to manually request indexing on your canonical homepage. Type https://www.your-domain.com (the canonical, not the redirecting one) into the search bar at the top of GSC, hit "Request Indexing", and Google will queue a fresh crawl for that exact URL. This is the fastest way to nudge Google to notice the change.
What this fixed for me
 Tap to expand
After the rule change, my indexed page count moved from 5 to 6 within the same week, the homepage's bare apex URL stopped being a "Page with redirect" entry and started behaving as a clean alternate URL pointing at the canonical, and clicks ticked up from 15 to 16. The "Redirect error" row in the Page indexing report is now actively re-validating instead of stuck on Failed.
Two things to watch out for:
1. **GSC takes its time.** The redirect change happened immediately, but GSC's bucket counts only update after Google re-crawls each affected URL. Expect the "Page with redirect" and "Alternate page with proper canonical tag" rows to shuffle around for one to two weeks.
2. **Multiple GSC properties can split the data.** If you have both a Domain property (covers all hosts) and a URL-prefix property (covers exactly one host), they'll show overlapping but slightly different numbers. Going forward, treat the Domain property as authoritative and use the URL-prefix property only for historical continuity. Don't delete the URL-prefix property right away or you lose its history.
The takeaway: when GSC says "Redirect error" with no further detail, the answer is almost always a redirect chain that's one hop too long, and curl -sIL is the fastest way to see exactly what the chain looks like. You can debug a redirect issue in five minutes from the command line that GSC will not finish validating for another four weeks. Use both: terminal for diagnosis, GSC for confirmation.
Quick update before we get into it: I passed the Google Analytics 4 certification last week. Yay me and happy Cinco de Mayo. Two weeks ago I wrote up how I set GA4 up on this site, so this article picks up where that one left off. Once the tag is firing and data is flowing, the natural next question is "okay, now what do I actually look at?" For me right now, the answer is the Traffic Acquisition report under Business Objectives > Generate Leads. It is hands down the most useful single view in GA4 at my current traffic volume, and it taught me why "sessions" is the wrong number to fixate on.
Before walking through the report itself, two GA4 vocabulary words are worth getting straight, because they show up everywhere and the official Google docs make them sound more complicated than they are.
What a session actually is
A session is one continuous visit. Someone shows up on your site, clicks around, then either leaves or sits idle for 30 minutes. That's one session. If they come back the next day, that's a second session. Sessions automatically end after 30 minutes of inactivity (you can change that under Admin > Data Streams > Configure tag settings > Adjust session timeout, but the default is fine for most sites). One person browsing your site for an hour without idling is one session. The same person closing the tab, then opening it again 35 minutes later, is two sessions.
What really matters is a session is an opportunity for a visitor to do something useful on your site. It is not a measure of whether they actually did. That distinction is why engaged sessions exist as a separate metric, which we'll get to.
Metrics vs dimensions
Every GA4 report is a table with rows and columns. The rows are dimensions and the columns are metrics. Dimensions are categories ("how do you want to slice the data"), metrics are numbers ("what do you want to count").
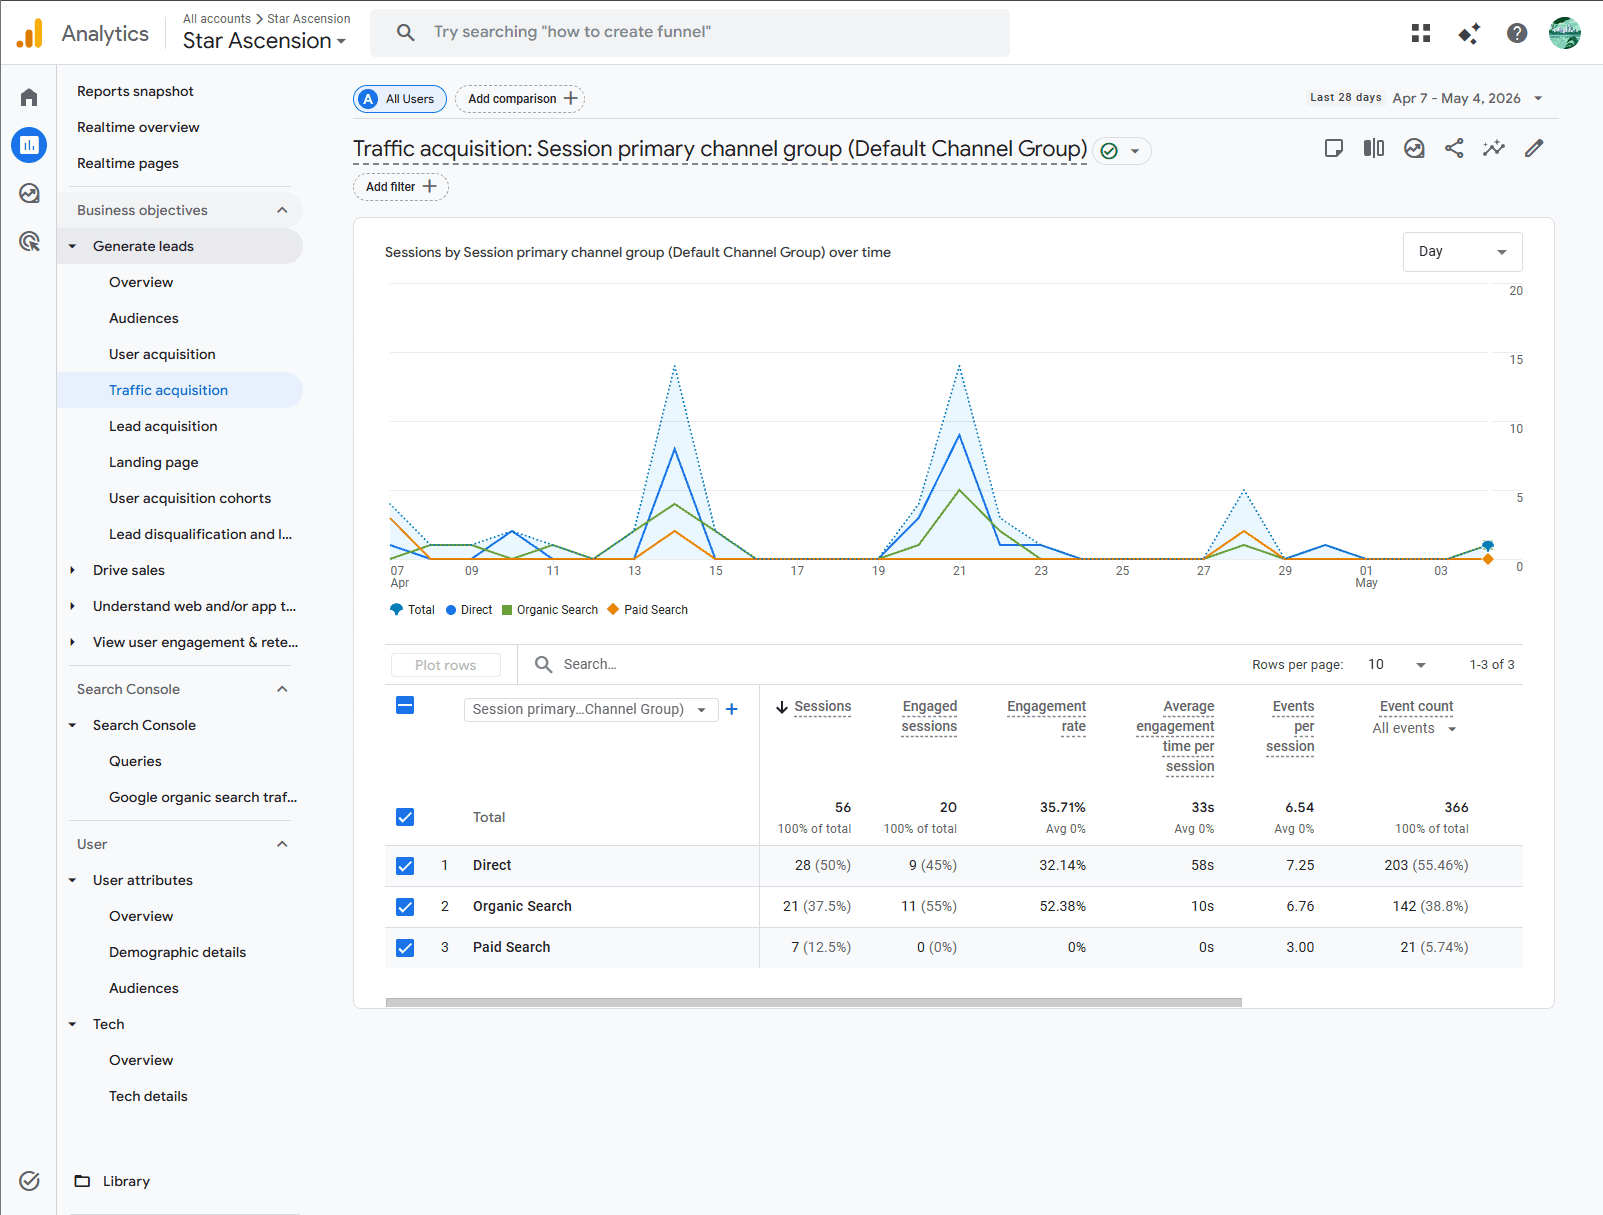
In the Traffic Acquisition report, the rows are channels (Direct, Organic Search, Paid Search) and the columns are numbers (Sessions, Engaged sessions, Engagement rate, Average engagement time per session, Events per session, Event count). Channel is the dimension. Sessions is a metric. Once you can make the disinction, reading and editing tables becomes easy-peazy, lemon-squeezy.
Why Traffic Acquisition is the most useful report right now (For me at the moment at least)
For a small site that's still figuring out what's working, Traffic Acquisition answers the most important strategic question in one table: "Where is my traffic coming from, and which sources actually engage?" Open it from the left sidebar under Reports > Business Objectives > Generate Leads > Traffic acquisition. Set the date range to the last 28 days in the top right. You should see something that looks like the screenshot below, with a line chart of sessions over time on top and a breakdown table underneath.
My current 28-day numbers tell a clean story: 56 total sessions, with Direct contributing 28 (50%), Organic Search 21 (37.5%), and Paid Search 7 (12.5%). At a glance, Direct looks like the biggest channel. But "biggest" and "best" are not the same thing, which is the whole point of this article.
Changing how sessions are grouped
Above the breakdown table, there's a dropdown labeled "Session primary channel group (Default Channel Group)." This is the dimension Google uses by default to group your sessions, and it's the right starting point. Direct, Organic Search, Paid Search, Email, and so on are all standard channel buckets that Google maintains.
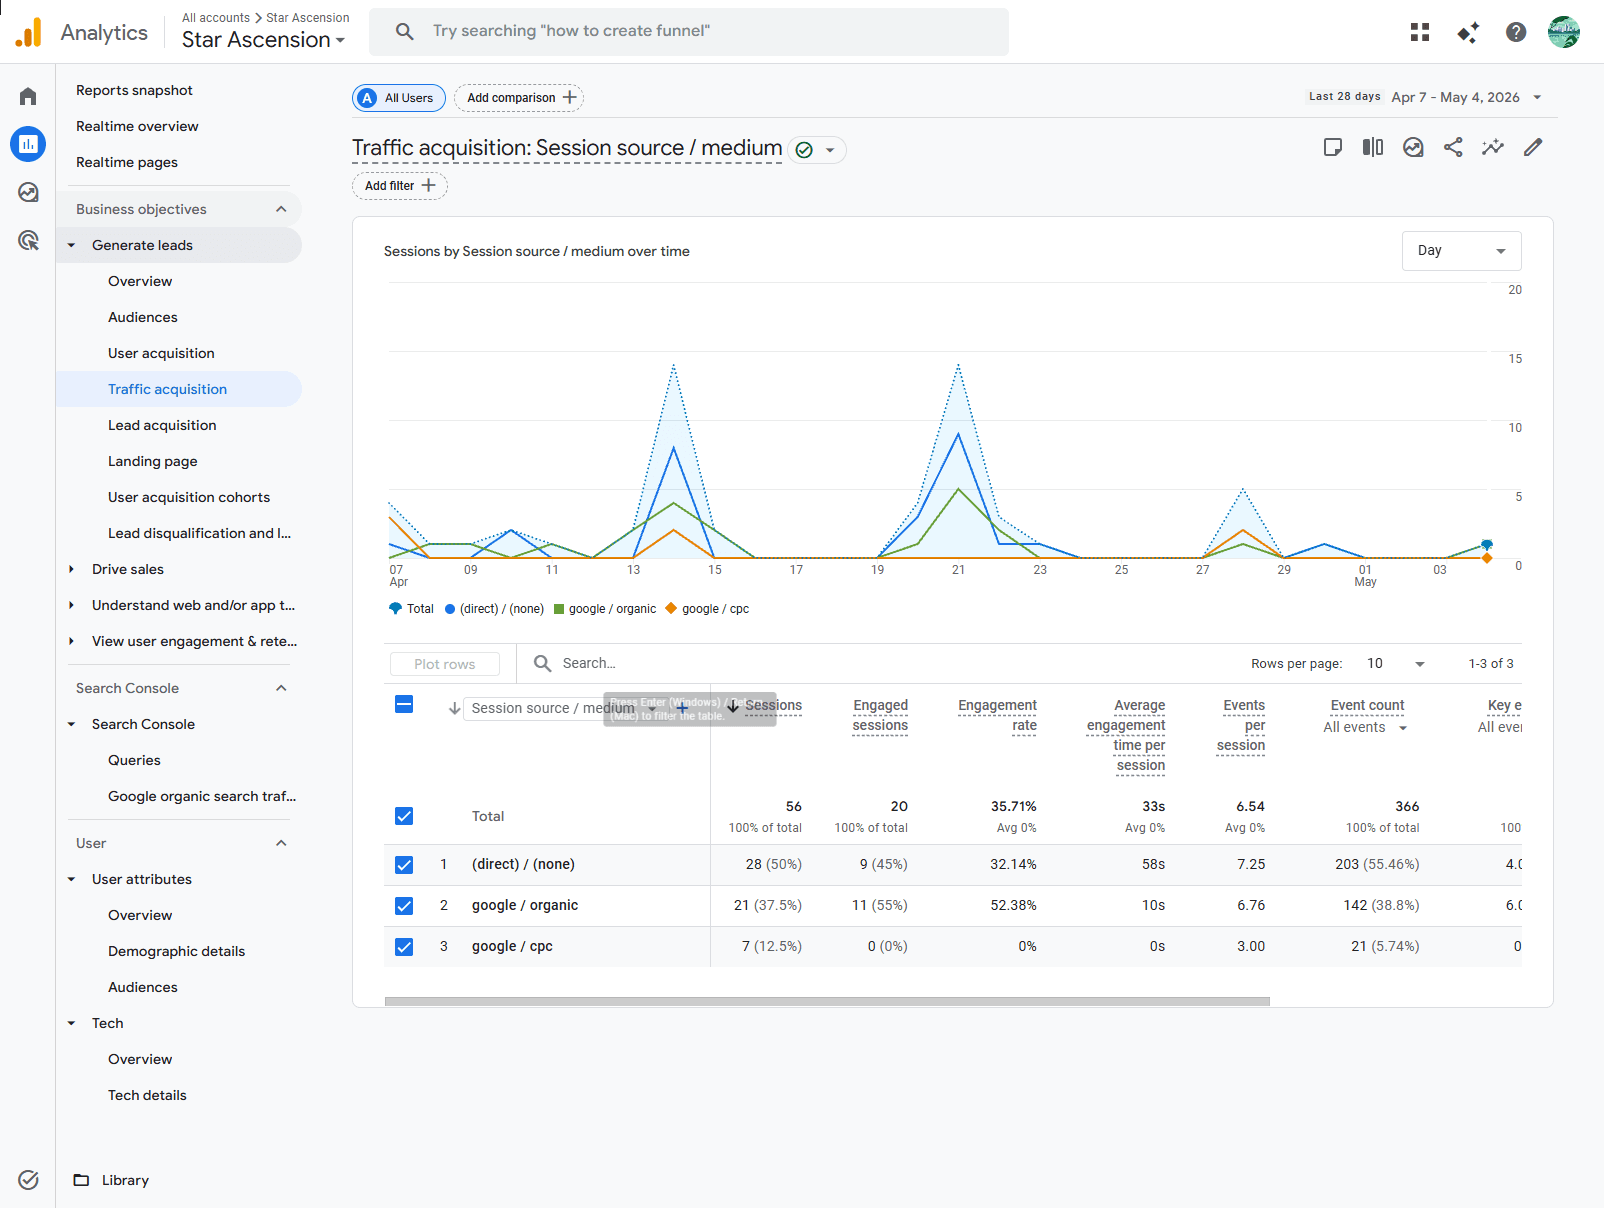
But the default channel group is a generalization. If you want to know exactly which source and medium pair drove a session ("was it a Google ad or a Bing ad? Was it google/organic or duckduckgo/organic?"), click that dropdown and switch to "Session source / medium." Same numbers, finer-grained breakdown. On my site the rows change from Direct, Organic Search, Paid Search to (direct)/(none), google/organic, and google/cpc. Same sessions, more specific labels.
For a small site with one ad campaign and no other paid sources, those two views show the same data twice. But the moment you start running ads on multiple platforms or get traffic from multiple search engines, switching to source/medium is how you tell them apart. You can also pin the source/medium dimension as a secondary breakdown by clicking the plus icon next to the dimension dropdown, which gives you both at once.
Why engaged sessions is the metric I'm watching most
 Tap to expand
Now look at the columns. Sessions tells you how many times someone showed up. Engaged sessions tells you how many of those visits actually counted. GA4 marks a session as "engaged" if any one of these is true:
1. The session lasted longer than 10 seconds
2. The user triggered a key event (We'll get more into events in a future article, because they're a whole topic on their own, but for now just know that a key event is something you set up to track meaningful actions like form submissions or quote requests)
3. The user viewed at least 2 pages or screens
Engagement rate is just engaged sessions divided by total sessions. It's the most useful single number for separating real visits from bounces and bots.
Here's why this matters more than raw sessions for my site right now. My 28-day Traffic Acquisition report shows:
- **Direct:** 28 sessions, 9 engaged (32.14% engagement rate, 58 sec avg engagement time per session)
- **Organic Search:** 21 sessions, 11 engaged (52.38% engagement rate, 10 sec avg engagement time)
- **Paid Search:** 7 sessions, 0 engaged (0% engagement rate, 0 sec)
 Tap to expand
If I only looked at sessions, Direct is the winner with 50% of all traffic. But engaged sessions tells a different story: Organic Search is the most engaged channel at 52% engagement rate, even though it has fewer sessions than Direct. And Paid Search, despite costing real money, produced 7 sessions with literally zero engagement(also I don't pay for ads, yet this metric keeps coming up 🤷♂️). Every single paid visitor bounced before hitting the 10-second threshold or seeing a second page. That tells me one of two things is happening: either the ad targeting is pulling in the wrong audience, or the paid clicks are bot traffic... Either way, raw sessions made it look like paid was contributing 12% of my traffic. Engaged sessions made it clear paid was contributing 0% of anything that mattered.
This is also why engagement rate is the metric I'm watching as the FAQ-content SEO experiment progresses. The hypothesis is "FAQ pages can be a real organic traffic source." Sessions can grow without proving the hypothesis (some of the growth could be bots or accidental clicks). Engaged sessions only grows if real humans are actually reading and exploring. As long as the engagement rate on Organic Search stays above 50%, I know the FAQ traffic is qualified, regardless of how the raw session count moves.
Sorting and customizing the report
The default sort is by Sessions descending, which makes the biggest channel the top row. To re-sort by engaged sessions, click the column header. The arrow flips and the table re-orders. Now I can immediately see which channels engage best, even if they don't have the most volume.
If you want to permanently reorder columns or add or remove metrics, click the pencil icon in the top right of the report ("Customize report"). The right-hand panel lets you add dimensions, add or remove metrics, change the chart type, and save the customized view. I usually leave the defaults alone (the pre-baked Traffic Acquisition report is already pretty good), but for the SEO experiment I added Average engagement time per session as a secondary sort. It's the closest single number to "are these visitors actually reading the content."
How I use this report every week
Three questions I ask the Traffic Acquisition report every Tuesday:
1. **Did the engagement rate on Organic Search hold up or improve?** If it dropped, the new FAQ I published probably isn't doing its job or Google simply hasn't crawled the new content yet.
2. **Did Direct grow?** Direct is the bucket Google uses when it doesn't know where someone came from. Growth in Direct usually means people are typing the URL or returning visitors are coming back, both of which are good signs. Or it's my mom checking out the new content, thanks mom!
3. **Did anything weird show up in source/medium?** If a new (referral) source appears, someone linked to me. If a strange paid source appears, something is misconfigured.
tl;dr
Sessions tells you how many visits you got. Engaged sessions tells you how many of those visits were real. For a small site early in its growth, engaged sessions is more honest. As traffic scales up, the gap between sessions and engaged sessions becomes the single most useful diagnostic for whether your traffic strategy is producing real visitors or just numbers on a chart. Now that I have the GA4 cert, I'm planning to lean harder into that distinction every week as the case study progresses.
Going back to our theme of GA4 (Google Analytics) and learning all the nifty things we can do with it, I'd like to share with you how I added custom event trackers to see how visitors interact with the 3D navigation cube on this site. I wanted to know if folks are actually using it to navigate, opting for the nav bar instead, spinning it for funsies, or looking at this thing like "what is going on" and bouncing. So I created a way to find out.
Step 1: What is the question?
This may seem obvious, but it's a valid approach to setting this up. My question was "who's using this cube that I spent so much time putting into my site, because I thought it would be a fun idea?" Now I'm pretty sure you don't have a big dumb cube in the center of your website, so what would you need event tracking for that isn't already built into GA4? Say you have a newsletter you want visitors to sign up for. You could create a "form_start" event to see when they begin filling it out, showing interest, and compare that to how often they actually submit. If you have an online clothing store, you could add "filter_usage" to track which specific filters (e.g., Color: Blue, Price: Under $50) are used most. If everyone filters for "Blue" but you only have two blue items, you found a supply gap. The point is to think about what user behavior matters to your business that GA4 doesn't capture out of the box, and then build a tracker for it.
Step 2: Add the tracker to your codebase
Now implementing this took me a little while to get perfectly right. I highly recommend using GA4's DebugView (Admin > Data Display > DebugView) and testing your events on localhost before committing to production and heading to happy hour. Custom events can take 24 to 48 hours to appear in GA4's standard reports, and if you're not collecting the right data, you'll have some explaining to do to the boss on Monday morning. DebugView shows events in real time as they fire, so you can click around your local dev environment and watch each event pop up instantly.
The foundation of my tracking setup is a single base helper function called trackEvent in a file I created at src/lib/analytics.ts. This function is the one that actually talks to GA4. It checks that the browser environment and the gtag function exist, then fires the event with whatever custom parameters you pass in, plus it automatically appends the current page path and a debug mode flag. Every other tracker on the site delegates to this one function, which means if I ever need to add a global parameter (like a session ID or a user role), I add it in one place and every event gets it for free.
On top of that base, I built three specialized trackers for the cube interactions. trackCubeSpin fires a "cube_spin" event with the direction of the spin (formatted as "Home -> About" so I can see exactly which face transitions are happening). trackCubeClick fires a "cube_face_click" event with the face name when someone double-clicks to scroll down into the content, which is the actual navigation action. And for the nav bar, I call trackEvent directly with a "navigation_click" event that includes which page they're navigating to, where they came from, and whether they're on mobile or desktop.
The code only solves half the problem though. You also need to call these trackers at the right moment in your components. For the cube spin, the tracker fires inside handleDragEnd in CubeScene.tsx, but only when the drag exceeds a 10-pixel threshold. Without that check, every tiny accidental touch on the cube would register as a spin and your data would be full of noise. For cube_face_click, it fires inside handleDoubleClick in the same file, meaning it only counts when someone deliberately double-clicks a face to navigate into the content, not when they single-click to rotate the cube to a face. Distinguishing between "browsing the cube" and "actually navigating" was the trickiest part of this whole implementation and took a few iterations to get right. The nav bar tracker is simpler: it fires inside handleNavClick in NavigationBar.tsx every time someone clicks a nav item, and the mobile vs desktop distinction comes from a window width check.
Before you deploy any of this, open DebugView in GA4 (Admin > Data Display > DebugView). Then run your site locally with npm run dev. The debug_mode flag I set in the trackEvent function is what tells GA4 to route events to DebugView instead of waiting for the standard processing pipeline. You'll see a live timeline of every event firing as you interact with the site. Click a cube face, spin the cube, use the nav bar, and watch each event appear with its parameters in real time. If something doesn't show up, you know the tracker isn't wired correctly before any bad data hits production. In my DebugView session below, you can see cube_face_click and cube_spin firing in sequence as I played with the cube, and navigation_click appearing when I used the nav bar. Exactly what I wanted.
Step 3: Create your custom event in GA4
Once your events are firing and you've verified them in DebugView, head over to Admin > Data Display > Events. This page shows every event GA4 has received from your data stream in the last 28 days. You'll see your custom events (cube_face_click, cube_spin, navigation_click) listed alongside GA4's automatically collected events like first_visit, page_view, and session_start. If your custom events aren't showing up here yet, give it up to 48 hours after the first production hit. DebugView events arrive immediately, but the Events admin page processes on its own schedule.
From this page you can star any event to mark it as a "key event" (what Universal Analytics used to call a conversion). For now, I'm leaving my cube events as regular events since I'm just gathering behavioral data, not optimizing a funnel. But if you're tracking something like a newsletter signup or a purchase, starring it here is how you get it into GA4's conversion reports and make it importable into Google Ads campaigns.
Step 4: Build a Free Form exploration
The standard GA4 reports are fine for a high-level overview, but they won't let you slice your custom events the way you need to. For that, go to Explore in the left sidebar and click Blank to create a new Free Form exploration. This is GA4's power tool for custom analysis. It lets you pick exactly which dimensions and metrics to display, apply filters, and build visualizations that the pre-built reports can't touch.
Here's how I set up mine to see all three cube-related events in one view. In the Variables panel on the left, add "Event name" as a dimension and "Event count" as a metric. Then in the Settings panel, drag "Event name" into Rows and "Event count" into Values.
The following step (5) will tell you how to create custom dimensions to get a better visualization, but for now: set "Event name matches regex" to cube_spin|cube_face_click|navigation_click. That regex uses the pipe character as an OR operator, so it pulls all three events into one table without any noise from page_view, session_start, scroll, or the dozens of other automatic events. You can also add "Total users" as a second metric in Values if you want to see how many unique visitors triggered each event, not just the total count. Set the cell type to "Bar chart" for a quick visual comparison.
Step 5: Create custom dimensions for better analysis
Here's where it gets really useful. Right now your exploration shows event counts, but it can't tell you which cube face was clicked most, which spin transitions are happening, or whether mobile visitors prefer the nav bar. That data is already being collected in your event parameters (face_name, spin_direction, target_page, device_type), but GA4 won't let you use custom parameters as dimensions in explorations until you register them as custom dimensions.
Go to Admin > Data Display > Custom definitions and click "Create custom dimension." For each parameter you want to analyze, enter a human-readable name, set the scope to "Event," and type the exact parameter name from your code. Here are the ones I registered for my cube tracking goal:
- "Face Name" with event parameter face_name (from cube_face_click, tells me which face people navigate to)
- "Spin Direction" with event parameter spin_direction (from cube_spin, shows the from-to transition like "Home -> About")
- "Target Page" with event parameter target_page (from navigation_click, which page they picked from the nav bar)
- "Origin Page" with event parameter origin_page (from navigation_click, where they were before clicking)
- "Nav Device Type" with event parameter device_type (from navigation_click, mobile_nav vs desktop_nav)
// src/lib/analytics.ts - Base event helper + custom trackers

// Base helper - every other tracker delegates to this
export const trackEvent = (eventName: string, params?: Record<string, any>) => {
  if (typeof window === 'undefined' || !window.gtag) return;

  window.gtag('event', eventName, {
    ...params,
    page_path: window.location.pathname,
    debug_mode: process.env.NODE_ENV === 'development',
  });
};

// Fires when user drags/spins the cube (CubeScene.tsx > handleDragEnd)
export const trackCubeSpin = (direction: string) => {
  trackEvent('cube_spin', {
    interaction_type: 'drag',
    spin_direction: direction   // e.g. "Home -> About"
  });
};

// Fires when user double-clicks a face to scroll down (CubeScene.tsx > handleDoubleClick)
export const trackCubeClick = (faceName: string) => {
  trackEvent('cube_face_click', {
    face_name: faceName,        // e.g. "About", "FAQ"
    engagement_category: 'navigation',
  });
};

// In NavigationBar.tsx > handleNavClick - fires on every nav item click
trackEvent('navigation_click', {
  target_page: item,            // e.g. "Services"
  origin_page: fromPage,        // e.g. "Home"
  device_type: isMobile ? 'mobile_nav' : 'desktop_nav'
});
Fair warning: custom dimensions take 24 to 48 hours to start populating with data after you create them. Events that fired before you registered the dimension won't retroactively fill in. So set these up now and let them marinate for a day or two before trying to use them in explorations.
Step 6: Use custom dimensions in your exploration
Once your custom dimensions are active (give it that 24 to 48 hours), go back to your Free Form exploration and add them to the Variables panel as dimensions. Now you can drag them into Rows alongside Event name for nested breakdowns that actually answer the question from Step 1.
Here's the exploration I'd build to answer "who's actually using this cube?" Create three tabs in the same exploration (click the + next to "Free form 1" at the top):
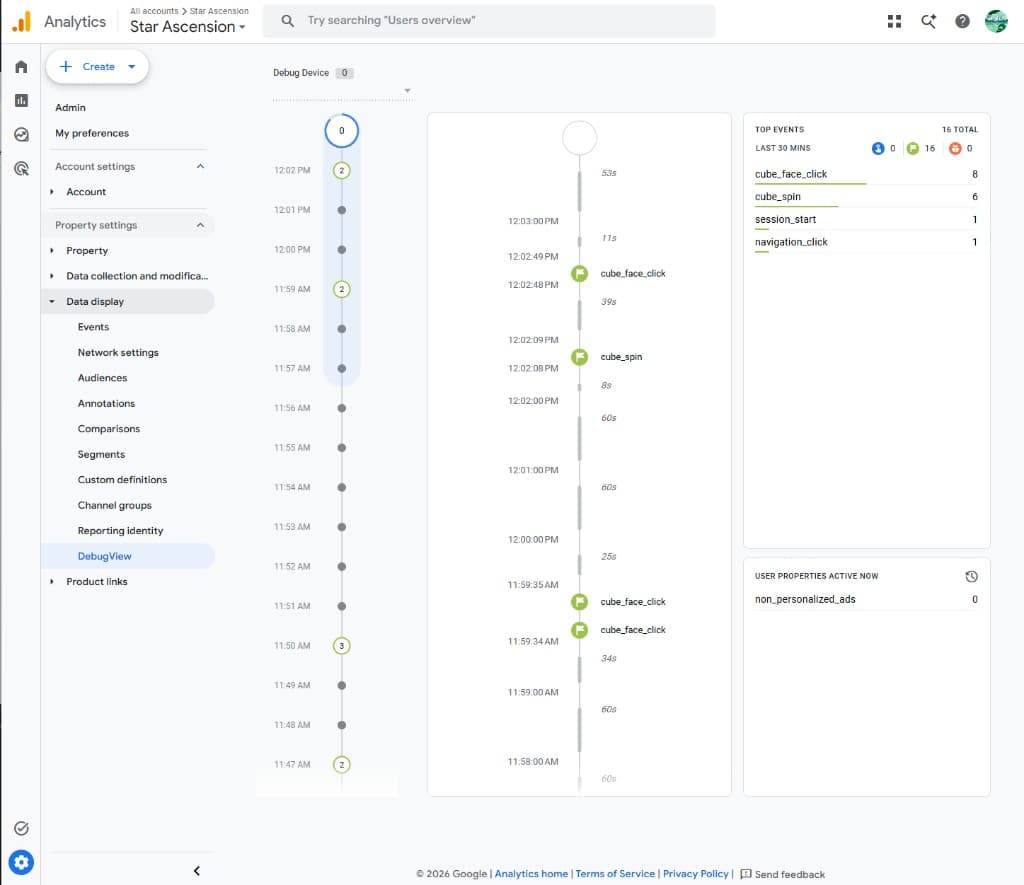 Tap to expand
Tab 1: Cube Navigation. Set Event name and Face Name as rows, Event count and Total users as values, filtered to cube_face_click only. This tells you exactly which faces people are navigating to and whether it's the same three users hitting "About" or a broad spread across visitors.
Tab 2: Nav Bar Usage. Set Event name and Nav Device Type as rows, with Target Page as a nested row underneath, filtered to navigation_click. This reveals whether mobile visitors lean on the nav bar more than desktop visitors (spoiler: they probably don't, since spinning a 3D cube on a phone is fun and oddly addicting).
Tab 3: Cube Exploration. Set Event name and Spin Direction as rows, filtered to cube_spin. This shows you the actual face-to-face transitions, which is frankly the most interesting data. If everyone is spinning from Home to About but nobody spins to FAQ, that tells me something about content discovery patterns I should pay attention to.
Between these three views you can answer: are people using the cube to navigate (cube_face_click count), are they exploring it out of curiosity (cube_spin count vs cube_face_click count, since spins without clicks mean they're playing but not committing), and do they fall back to the nav bar when they want to get somewhere specific (navigation_click count, especially on mobile).
My early numbers show 72 spins, 20 face clicks, and 7 nav clicks over the last 28 days. That ratio tells me people are definitely engaging with the cube and most of the interaction is exploratory spinning, which is exactly what I was hoping for. Only a handful of visitors used the nav bar, which is either a good sign that the cube is intuitive or a concerning sign that nobody scrolls far enough to need the nav. Once the custom dimensions populate, I'll know which one it is.
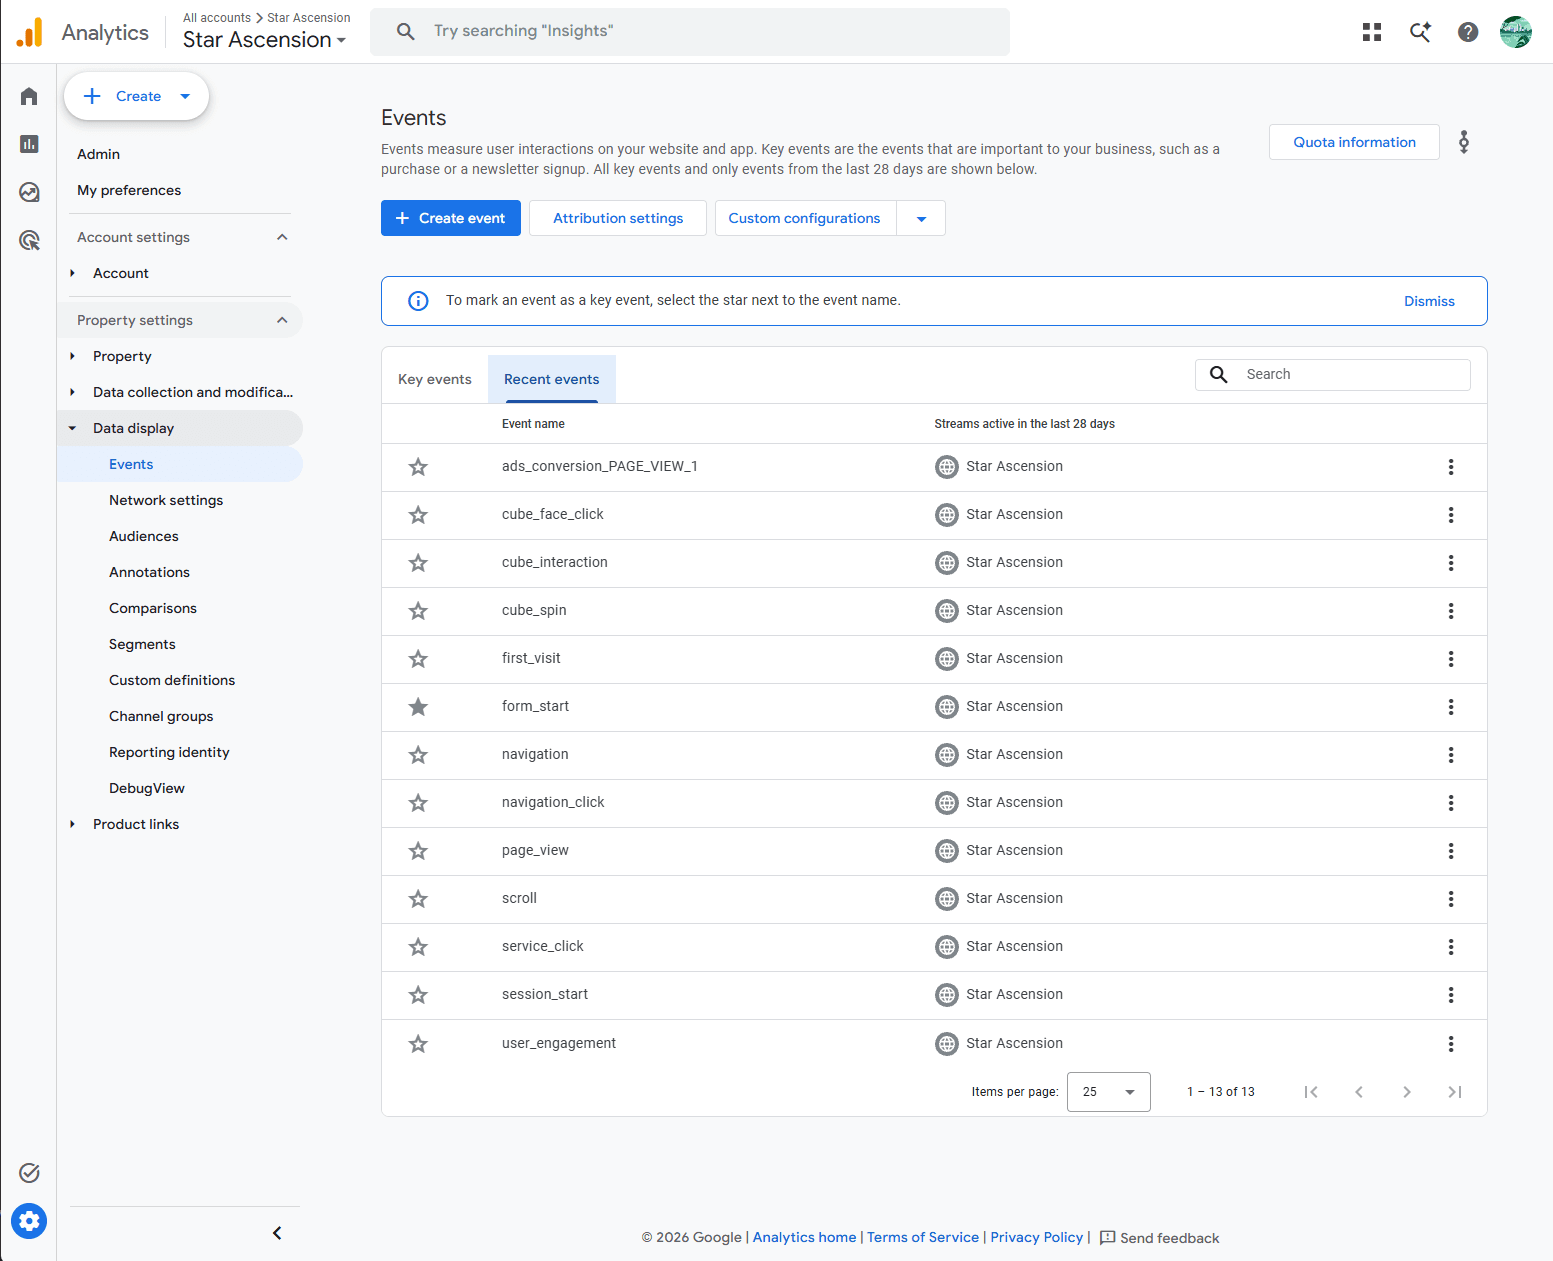 Tap to expand
This is the article that wraps up the SEO experiment, and it ends exactly where I expected. I set out to prove that SEO isn't dead, that a brand-new site could generate real organic traffic using only FAQ content, Schema.org structured data, and zero advertising budget. The answer is yes. From zero impressions at Week 0 to 19 all-time clicks, 6 indexed pages, and steady organic search traffic by Week 9, the traditional SEO playbook works... Barely. Google found the site, indexed it, and started sending people. SEO is alive.
But 19 all time clicks won't keep the lights on, unless it's from Warren Buffett and he wants to buy your company, but you'd have a better chance of getting struck by lighting 3 times while robbing a bank, wearing a living skunk on your head. You (and I) need more clicks. Enter the confusing world of (GEO: Generative Engine Optimization)
The experiment that proved the point
To demonstrate the ceiling, I asked Google's AI to find Star Ascension. Not the website, the actual business. I typed "star ascension web development" into an AI search engine, and it had no idea what I was talking about. It recommended a Roblox clicker game. A tabletop RPG from Radiant Gaming Systems. An 11-book sci-fi series on Amazon. An unrelated agency called "Ascend Web Development." It confidently explained what each of those was while completely ignoring the site that ranks on Google page 1 for its own brand name.
I tried again. "No, I want star-ascension web development." Same result. The AI scraped together suggestions about Stellar blockchain integrations, component "ascension" architecture patterns, and game dashboard builders. I finally had to paste the URL directly into the conversation and say "here, I found it for you." Only then did it acknowledge the business existed, pull in the services, pricing, and even reference this case study. Once it had the URL, it gave a perfectly accurate summary. But without that URL, we didn't exist.
Traditional search vs AI search: two different games
This happened because traditional SEO and AI search operate on fundamentally different retrieval models. When you type a query into Google Search, it scans a deterministic inverted index for explicit text matches. If your domain is "star-ascension.com" and you optimize for "star ascension web development," Google serves your site. That's what this entire experiment proved over nine weeks.
AI models don't work that way. They process queries through statistical probability and semantic association. When an AI encounters "Star Ascension," it weights the phrase toward the entities with the largest digital footprint: a Roblox game with millions of players, a tabletop RPG with published rulebooks, an 11-book series on Amazon. These entities dominate the semantic space because they're discussed, cited, and linked across thousands of independent sources. A boutique web development studio with great articles, FAQ content that probably no one reads except my mom, and clean Schema markup doesn't register in that statistical model because its entire footprint lives on a single domain.
SEO vs GEO: why the difference matters now
This gap has a name. SEO (Search Engine Optimization) optimizes your domain so search engines can find you when someone types the right query. GEO (Generative Engine Optimization) optimizes your brand's presence across the broader web so AI models recognize you as an entity worth recommending.
The distinction matters because search isn't just shifting. As of May 2026, it already shifted.
Google I/O 2026 put a number on it
At Google I/O on May 19, 2026, Sundar Pichai announced that AI Mode has crossed 1 billion monthly active users, roughly 10x growth in 12 months. AI Overviews now serves 2.5 billion. The majority of Google's search traffic is flowing through an AI layer before users ever reach a traditional result.
Three stats from the post-I/O research connect directly to what this experiment ran into. First, Ahrefs benchmarks show position #1 organic CTR drops 34.5% when AI Overviews appear on the SERP. Ranking first means less than it used to. Second, only 17-54% of AI Overview citations now come from top-10 organic results, down from 76% in mid-2025. Your site can rank and still not get cited in the AI answer. Third, sites with strong brand recognition (cross-web presence through directories, social, and third-party mentions) lost 22% of search referrals over two years, while weaker brands lost 60%. That 38-point gap is exactly the gap this experiment fell into by design.
For the full breakdown of what changed and the 90-day operational playbook for SEO teams, I'd recommend Digital Applied's SEO After Google I/O 2026: What Changes for Teams. It compiles research from Ahrefs, Pew Research, Amsive, Seer Interactive, modo25, and Launchcodex into the most actionable post-I/O analysis I've found.
What builds AI visibility that pure SEO doesn't?
The rules of this experiment intentionally excluded every signal that AI models rely on:
No backlinks or outreach meant no third-party sites referencing the business. AI models trust a brand when independent, authoritative sources mention it consistently.
No social media promotion meant no Reddit threads, no LinkedIn posts, no Twitter discussions. AI models pull heavily from social platforms for entity recognition and validation.
No directory submissions meant no Clutch profile, no Google Business Profile, no industry listings. These structured databases are exactly what AI crawlers use to verify that a business exists as a real entity.
No advertising meant no Google Ads landing page data, no retargeting footprint, no brand awareness lift from paid impressions that spill over into organic recognition.
Every one of those constraints was designed to test pure content SEO in isolation. And pure content SEO passed that test. But it also confirmed what the I/O 2026 data makes obvious: pure content SEO is not enough to drive traffic or exist in the AI layer of the internet. You can rank on Google page 1 for your brand name and still be completely invisible to every AI-powered search experience. Without ads driving visitors to your site and GEO building your brand across the web, ranking is just a line item on a dashboard nobody sees.
What this means for the experiment
Looking back at the numbers, the traditional SEO strategy delivered exactly what it promised. Starting from absolute zero with no budget, the site went from 0 impressions and 0 clicks to 19 all-time clicks across 6 indexed pages. Organic search users appeared by Week 2 and grew steadily. The FAQ page nearly matched the homepage for organic impressions by Week 6. Engagement rates on organic traffic consistently outperformed every other channel, with organic search hitting 52% engagement versus 0% for paid search. For a brand-new domain with zero advertising spend, those numbers validate SEO as a foundation.
But a foundation isn't a strategy. Traditional SEO gets you indexed and ranking. Ads get you traffic. GEO gets you into AI-generated conversations. And as those conversations become the default way people discover new businesses, you need all three working together.
The takeaway for any small business
If you're building a new brand or running a small business, traditional SEO is still the foundation. Write useful content, mark it up with Schema.org, keep your technical house clean, and Google will find you. This experiment proved that from zero, and nothing about Google I/O 2026 changes that baseline requirement.
But if you stop there, you're building on a surface that is shrinking. With 1 billion users in AI Mode and position #1 CTR dropping 34.5% when AI Overviews appear, traditional organic rankings deliver less traffic every quarter. And the 22% vs 60% brand-equity referral-loss gap means businesses without cross-web presence are losing ground three times faster than those with it.
The practical steps haven't changed since the beginning of SEO. They've just expanded. Get listed in business directories and Google Business Profile. Earn mentions on third-party sites. Build a social presence. Participate in communities where your audience already is. Create enough cross-web signal that when someone asks an AI to "find me a web developer," the model has enough independent evidence to recommend you by name.
Citation share is the new rank. Brand equity is the new defense. Ads are the engine that drives traffic to your optimized pages. And pure organic SEO, the thing this entire experiment was built to test, is the foundation that makes everything else work but no longer the strategy that wins on its own.